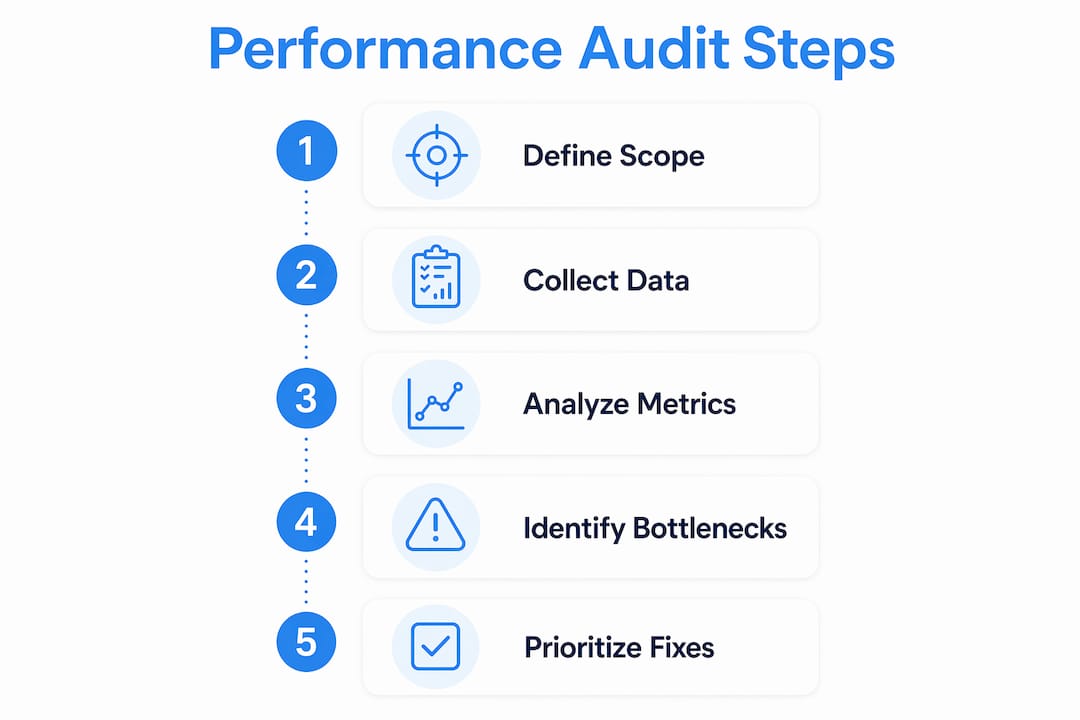
A website performance audit is a methodical evaluation of your site’s speed, stability, and user experience, designed to uncover technical bottlenecks and prioritise fixes that deliver measurable results. The process draws on two distinct data types: field data from real users and lab data from controlled tests. Standards such as Core Web Vitals, Time to First Byte (TTFB), and Lighthouse scores give you objective benchmarks to measure against. This guide walks you through the website performance audit step by step, from scoping your work to building a monitoring routine that prevents regression.
What does a website performance audit step by step involve?
A performance audit is not a single tool report. It is a structured process that combines field and lab data to diagnose both real-user experience and reproducible technical issues. Field data reflects how actual visitors experience your site. Lab data gives you a controlled environment to debug specific problems.
The distinction matters because a tool report alone will flag issues without telling you which ones hurt real users most. Combining Chrome User Experience Report data with lab tools like Google PageSpeed Insights or WebPageTest gives you a complete picture. That combination is the foundation of every reliable audit.

Core Web Vitals are the primary framework Google uses to assess page experience. They measure Largest Contentful Paint (LCP) for loading speed, Interaction to Next Paint (INP) for responsiveness, and Cumulative Layout Shift (CLS) for visual stability. TTFB sits upstream of all three. If your server is slow, no front-end fix will rescue your scores.
How do you define the scope and objectives of your audit?
Clear objectives separate a useful audit from a list of complaints. Before you run a single test, decide what you are trying to achieve. Common goals include improving Google search rankings, reducing bounce rate on key pages, or preparing for a site redesign.
Once you have a goal, identify which page templates to test. Most sites share a handful of structural templates: homepage, category or listing pages, product or service pages, blog posts, and conversion landing pages. Auditing only the homepage misses the performance variation across templates and skews your findings. A product page with a large image carousel behaves very differently from a lightweight blog post.
Scope also determines how long the audit takes. A focused audit on five core templates can be completed in a day. A full-site crawl across hundreds of URLs requires a longer timeline and more tooling. Match your scope to your objective and your available time.
- Define your primary goal before opening any tool (ranking, conversion, redesign readiness).
- List your core page templates and select at least one URL from each.
- Note recent changes such as CMS updates, new plugins, or hosting migrations that may have introduced regressions.
- Set a baseline date so you can measure improvement after fixes are applied.
Pro Tip: If you manage an e-commerce site, always include your highest-revenue product page and your checkout page in the audit scope. These pages carry the most commercial risk from poor performance.
Which tools should you use to collect performance data?
The right tools depend on whether you need field data, lab data, or both. A reliable audit uses both.
| Tool | Data type | Best use case |
|---|---|---|
| Chrome User Experience Report (CrUX) | Field | Real-user Core Web Vitals over 28 days |
| Google Search Console | Field | Page Experience report and CrUX integration |
| Google PageSpeed Insights | Field + Lab | Quick combined view per URL |
| WebPageTest | Lab | Detailed waterfall charts and multi-step testing |
| Lighthouse (in Chrome DevTools) | Lab | On-demand audits with actionable diagnostics |
| Lighthouse CI | Lab | Automated checks in deployment pipelines |
Google Search Console is the starting point for field data. It surfaces Core Web Vitals issues grouped by URL pattern, so you can see which templates are failing at scale. Google PageSpeed Insights then lets you drill into individual URLs and see both the CrUX field data and a Lighthouse lab score side by side.
WebPageTest is the most powerful lab tool for deep diagnosis. Its waterfall chart view shows every asset your page loads, in sequence, with precise timing for DNS resolution, connection, TTFB, and download. That level of detail is where real bottleneck identification happens.
- Use Google Search Console to identify which page groups fail Core Web Vitals thresholds at scale.
- Use Google PageSpeed Insights for a quick combined field and lab view on specific URLs.
- Use WebPageTest when you need to trace the exact cause of a loading delay.
- Use Lighthouse CI to automate checks and catch regressions before they reach production.
How do you analyse key metrics and find bottlenecks?
This is where the audit produces its real value. Start with TTFB. A TTFB above 600ms typically points to backend problems: slow database queries, underpowered hosting, or missing server-side caching. Front-end work cannot compensate for a slow server. Fix the backend first.
Next, open a waterfall chart in WebPageTest. Waterfall charts show the full loading sequence, including which resources block rendering and which load in parallel. Look for render-blocking JavaScript or CSS that sits on the critical path. These are the assets the browser must process before it can display anything to the user.
Reading Core Web Vitals
LCP measures how long it takes for the largest visible element to load. For most pages, that is a hero image or a large heading. A slow LCP usually traces back to an unoptimised image, a slow server response, or render-blocking resources delaying the image request. INP replaced First Input Delay in 2024 and measures the full response time to any user interaction. High INP scores point to heavy JavaScript execution on the main thread. CLS measures unexpected layout shifts. Common causes include images without declared dimensions and fonts that swap after the page renders.
Inspecting asset loading
After reviewing Core Web Vitals, examine your asset inventory. Large, uncompressed images are the most common cause of slow LCP. JavaScript files that load synchronously in the document head block all rendering until they finish. Third-party scripts, such as chat widgets or analytics tags, frequently add significant weight without appearing in your own codebase.
Pro Tip: Sort your waterfall chart by file size and look at the top ten assets. If any image exceeds 200KB, it is almost certainly a quick win. Convert it to WebP and add explicit width and height attributes to eliminate layout shift at the same time.
How do you prioritise performance issues for effective remediation?
Most audit reports treat every failure as equally urgent. That approach wastes time. 80% of audits neglect to classify issues by impact and effort, which means teams often fix the easiest problems rather than the most valuable ones.
The correct framework plots each issue on two axes: user experience impact and implementation effort. A server-side caching fix that improves TTFB for every page on your site is high impact and often low effort. Shaving 5KB from a rarely loaded CSS file is low impact regardless of effort. Fix the high-impact, low-effort items first.
Fixing critical path CSS and JavaScript delivers the fastest performance gains because it improves multiple metrics simultaneously. Pursue micro-optimisations on minor assets only after the critical path is clean.
Set a performance budget to make prioritisation systematic. A performance budget defines the maximum acceptable page weight, the maximum number of HTTP requests, and the minimum Lighthouse score for each page template. When a proposed change would breach the budget, it is blocked until the team resolves the conflict. This turns performance from a one-off project into a standing constraint on development.
- Map every finding to a user-facing metric (LCP, INP, CLS, TTFB, or page weight).
- Score each issue on impact (high, medium, low) and effort (high, medium, low).
- Fix high-impact, low-effort issues first to build momentum and demonstrate results quickly.
- Document deferred items with a rationale, so they are not forgotten.
- Set a performance budget and integrate it into your deployment checklist.
How often should you run a performance audit?
Performance degrades gradually. A plugin update, a new marketing script, or a CMS upgrade can each shave points off your Lighthouse score without anyone noticing. Audits conducted monthly, or immediately after significant site changes, catch these regressions before they compound.
Monthly audits are the minimum for active sites. Sites that publish frequently or run regular campaigns should audit after every major release. The audit does not need to be exhaustive each time. A focused monthly check on Core Web Vitals field data and a Lighthouse run on key templates takes less than two hours.
Automation reduces that burden further. Integrating Lighthouse CI into your build pipeline means every deployment is tested against your performance budget before it goes live. Regressions are caught at the source, not discovered weeks later in a manual audit.
- Run a full audit monthly and after every major change (redesign, hosting migration, CMS update).
- Automate Lighthouse CI in your deployment pipeline to catch regressions before they reach users.
- Monitor Google Search Console weekly for new Core Web Vitals failures at template level.
- Keep a performance log with dated Lighthouse scores and field data snapshots to track trends over time.
Pro Tip: Set a calendar reminder for the first Monday of each month. Pull your Google Search Console Core Web Vitals report, compare it to last month’s snapshot, and note any templates that have moved from “Good” to “Needs Improvement.” That 15-minute check is often enough to catch a problem early.
Key takeaways
A website performance audit is only as useful as the prioritisation framework applied to its findings. Combining field data with lab data, auditing multiple page templates, and fixing critical path issues before minor assets are the three practices that separate effective audits from wasted effort.
| Point | Details |
|---|---|
| Combine data types | Use both field data (CrUX) and lab data (Lighthouse, WebPageTest) for a complete diagnosis. |
| Audit multiple templates | Testing only the homepage misses performance variation across category, product, and landing pages. |
| Fix TTFB first | A server response above 600ms cannot be compensated by front-end changes alone. |
| Prioritise by impact and effort | Address high-impact, low-effort fixes first; defer micro-optimisations on minor assets. |
| Audit monthly and automate | Run full audits monthly, and integrate Lighthouse CI to catch regressions before deployment. |
What I have learned from running performance audits
The most common mistake I see is treating the audit report as the deliverable. Teams spend days generating findings and then hand over a spreadsheet that nobody acts on. The audit is only the diagnostic phase. The real work is the prioritisation conversation that follows.
I have also noticed that poor prioritisation is almost always a communication problem, not a technical one. Developers know which fixes matter. The difficulty is explaining to a non-technical stakeholder why fixing a slow database query is worth more than compressing a single image. I now present every audit finding with a one-line business impact statement alongside the technical description. That change alone has accelerated fix timelines considerably.
The other lesson is that speed and experience are not always the same thing. A page can score 95 on Lighthouse and still feel sluggish if the layout shifts after the user starts reading, or if a font swap flashes white text for half a second. Core Web Vitals capture most of this, but your own eyes on the page matter too. Always watch a real video recording of the page loading before you close an audit.
— Rob
Cloud 9’s approach to website performance for UK businesses
Performance auditing is not a one-off task. For established UK businesses, it is an ongoing discipline that sits alongside web design and development, hosting management, and SEO. Cloud 9 builds performance budgets and monthly audit routines into every managed website engagement, so clients are not left discovering problems after they have already damaged rankings or conversion rates.

Cloud 9’s managed hosting and website care service includes regular Lighthouse checks, Core Web Vitals monitoring via Google Search Console, and proactive fixes before issues escalate. If your site has never had a structured performance review, or if your last audit produced a report that gathered dust, Cloud 9 can run a full audit and deliver a prioritised remediation plan your team can act on immediately.
FAQ
What is a website performance audit?
A website performance audit is a structured review of your site’s speed, stability, and user experience metrics. It combines field data from real users with lab data from controlled tests to identify and prioritise technical bottlenecks.
How long does a performance audit take?
A focused audit covering five core page templates can be completed in a single afternoon. A structured audit of a larger site with automated tooling typically takes one to two days.
What is TTFB and why does it matter?
TTFB (Time to First Byte) measures how long the server takes to respond to a request. A TTFB above 600ms indicates backend issues that front-end optimisations cannot fix.
How often should I audit my website’s performance?
Conduct a full performance audit at least monthly and after every significant site change. Automate Lighthouse CI in your deployment pipeline to catch regressions between manual audits.
What are Core Web Vitals?
Core Web Vitals are Google’s three primary page experience metrics: LCP (loading speed), INP (responsiveness), and CLS (visual stability). They directly influence Google search rankings and reflect real user experience.