Slower page, app and CRM response times cause abandonment, lower conversion and drive up churn. Every additional second of delay at checkout can cost roughly 4% of revenue per visitor, and mobile speed gains of just 0.1 seconds have driven single-digit conversion lifts across 37 retail and travel brands. The mechanism is simple: a slow response feels like friction, and friction changes behaviour, and changed behaviour shows up on the revenue line within weeks.
- A delay reads as unreliability before a customer consciously notices the wait.
- Unreliability triggers abandonment, particularly at checkout, contact forms and CRM-driven interactions.
- Repeated poor experiences erode trust faster than a single outage, because customers learn to expect friction.
Pro Tip: Treat response time as a retention metric, not just a technical one. Report it alongside churn and conversion in the same dashboard your leadership team already reads.
Key Takeaways
Faster technical response times protect revenue because slower page, API and CRM latency directly increases abandonment, reduces conversion and raises customer churn.
| Point | Details |
|---|---|
| Checkout is most sensitive | Slowdowns at checkout and lead forms cause disproportionately higher abandonment than elsewhere in a session. |
| Small gains, real returns | A 0.1 second mobile speed improvement has driven conversion lifts of 8 to 10% across retail and travel. |
| Track INP, not just load time | INP measures responsiveness across a whole session and now fails on many script-heavy B2B sites. |
| Fix CRM latency separately | Synchronous CRM and webhook calls need their own monitoring, since generic speed tools miss them. |
| Assign named ownership | SLOs only hold when one person, not “the team,” is accountable for each metric. |
| Cloud 9 manages the full chain | Cloud 9 pairs performance audits with managed hosting and CRM automation support to fix latency end to end. |
Table of Contents
- Why response time affects retention
- Which response time metrics should you actually track?
- What causes slow response times in the first place?
- Fixing response time: where to start and what to fix first
- How do you prove the fix actually reduced churn?
- Who owns response time once it’s fixed?
- What client work keeps teaching us about speed and churn
- How Cloud 9 helps you stop losing customers to slow systems
- Sources
- FAQ
Why response time affects retention
Retention is a trust problem disguised as a technical one. Customers form a judgement about reliability within the first few interactions, and slow systems tell them, correctly or not, that a business is cutting corners elsewhere too.
The data backs this up with uncomfortable precision. Over half of mobile visitors abandon a page that takes longer than three seconds to load, and most users expect a response within two. Once past that window, bounce probability climbs sharply rather than gradually, which is exactly why “it’s only a second slower” is such a dangerous line inside a business.
Checkout and other high-intent moments are where this bites hardest. Harvard Business School research on website speed and customer behaviour found customers are more sensitive to slowdowns during checkout than at other points in a session, with sensitivity diminishing for delays occurring later. That’s a useful, counterintuitive finding: fixing a slow homepage carousel matters less than fixing a sluggish payment step.
- A 0.1 second mobile speed improvement correlated with an 8% conversion lift for retail and 10% for travel brands alongside nearly 10% higher average spend.
- Good Largest Contentful Paint sits under 2.5 seconds; good Interaction to Next Paint sits under 200 milliseconds; good Cumulative Layout Shift stays under 0.1.
- Sites closing the gap between “needs improvement” and “good” LCP have recovered 15 to 40% of previously lost conversions.
Which response time metrics should you actually track?
You cannot manage what you’re not measuring, and most businesses measure the wrong layer. Frontend and backend performance both feed retention, but they fail in different ways and need different instruments.
On the frontend, track LCP (how fast the main content renders), INP (how responsive the page feels to interaction, replacing the old First Input Delay metric in 2024), CLS (visual stability) and Time to Interactive. INP is the one catching businesses out: it measures latency across an entire session rather than just the first click, which is why many JavaScript-heavy B2B and SaaS sites now fail it while still passing older checks.
On the backend, watch Time to First Byte, API response latency, database query time, and CRM or webhook latency. That last one is routinely ignored, yet a synchronous call to a CRM on page load can silently add seconds to a form submission.
- Use Real User Monitoring (RUM) to capture what actual visitors experience across devices, networks and locations.
- Use synthetic testing to catch regressions before release, in a controlled, repeatable environment.
- Chrome UX Report data refreshes on a rolling 28-day window, so real-time RUM catches problems days or weeks before CrUX would show them.
- Layer in an APM tool for backend tracing and CDN or edge monitoring for delivery bottlenecks.
Pro Tip: Instrument CRM and webhook calls separately from page load metrics. A form that “loads fine” but hangs for three seconds on submission will still torch your conversion rate, and generic speed tools won’t see it.
What causes slow response times in the first place?
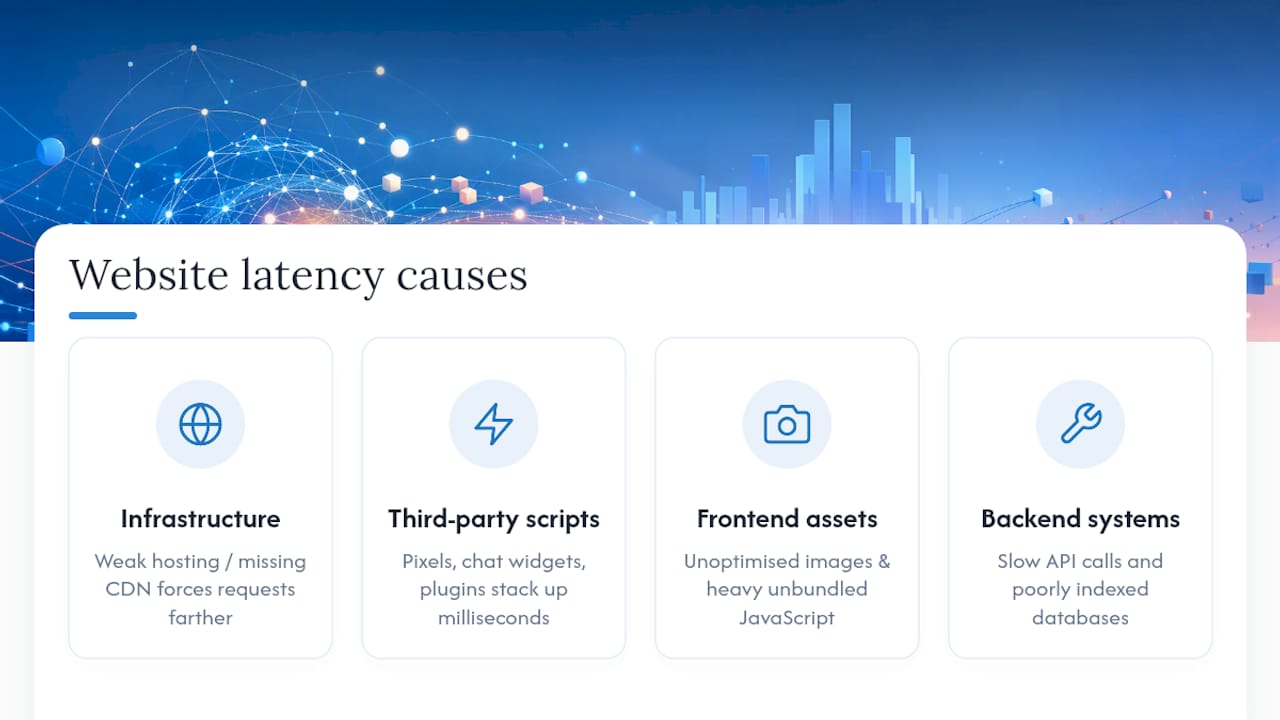
Most latency problems trace back to a handful of repeat offenders, and they rarely show up alone. Weak hosting infrastructure or a missing CDN forces every visitor’s request to travel further than it needs to. Third-party scripts, tracking pixels, chat widgets, review plugins, quietly stack up milliseconds until a page that felt fast in testing feels sluggish in production. Unoptimised images and heavy, unbundled JavaScript do the same on the frontend, while slow API calls or poorly indexed databases do it on the backend. None of these appear dramatic individually. Together, they’re why a site that “should” load in under two seconds takes five.
Fixing response time: where to start and what to fix first
Not every fix deserves the same urgency, and treating them as equal is how performance projects stall. Split remediation into what you can ship this month and what needs a proper project.
Quick wins (low effort, fast payback):
- Compress and correctly size images, especially hero images above the fold.
- Enable browser caching and put a CDN in front of static assets.
- Defer or lazy-load non-critical JavaScript, including marketing pixels and chat widgets.
- Strip unnecessary payload from checkout, contact and lead-capture pages specifically, since these pages carry the highest cost per second of delay.
Higher-effort remediation (bigger impact, needs planning):
- Audit and reduce third-party script load, often the single biggest hidden cost on a marketing site.
- Move to server-side or edge rendering where a full client-side render is dragging down INP.
- Optimise slow database queries and API endpoints identified through APM tracing.
- Rebuild pages carrying legacy code that no longer matches current traffic patterns; sometimes a full redesign outperforms incremental patching.
CRM and automation specific fixes:
- Remove synchronous CRM calls from the page load path; fetch that data asynchronously instead.
- Queue webhooks and retry them on failure rather than blocking the user-facing action.
- Add timeouts and a graceful fallback for any third-party API a form or automation flow depends on.
Fix homepage and product or service pages first for traffic volume, then checkout and contact forms for conversion sensitivity, then case study and spec pages for lead quality.
Pro Tip: Run every quick win through a before/after synthetic test. It takes ten minutes and stops you shipping a “fix” that quietly breaks something else.
How do you prove the fix actually reduced churn?
Speed improvements only earn budget when they’re tied to a number a finance director cares about. Run the validation properly and that number practically writes itself.
- Define two comparable cohorts and stage the rollout, one group on the improved version, one on the baseline, over at least two to four weeks to smooth out day-of-week noise.
- Measure conversion rate, cart abandonment and 30 to 90 day retention across both cohorts, not just the immediate click-through.
- Convert the conversion lift into revenue: multiply the percentage lift by average order value and traffic volume, then project it against average customer lifetime value to estimate the retention gain in cash terms.
- Cross-reference against sites that closed their LCP gap and recovered 15 to 40% of lost conversions, a useful benchmark for what “success” should look like in your own data.
Cohort analysis is what separates a correlation from a story you can defend in a board meeting. If retention improves in the faster cohort while everything else stays constant, you have your case.
Who owns response time once it’s fixed?
Performance regresses the moment nobody owns it. Set concrete service level objectives: mobile LCP under 2.5 seconds, INP under 200 milliseconds at the 75th percentile, and API 95th-percentile latency targets specific to your stack.
- Platform and ops own infrastructure, hosting and CDN configuration.
- Development owns code-level fixes: scripts, rendering, queries.
- Product and marketing own which pages get prioritised, since they know where conversion sensitivity is highest.
- Add a performance gate to every release, run synthetic checks pre-deployment, validate with RUM post-deployment, and review the numbers monthly, not annually.
Pro Tip: Put one named person’s initials against each SLO in your ticketing system. “The team” owning a metric is how metrics quietly stop being owned at all.
What client work keeps teaching us about speed and churn
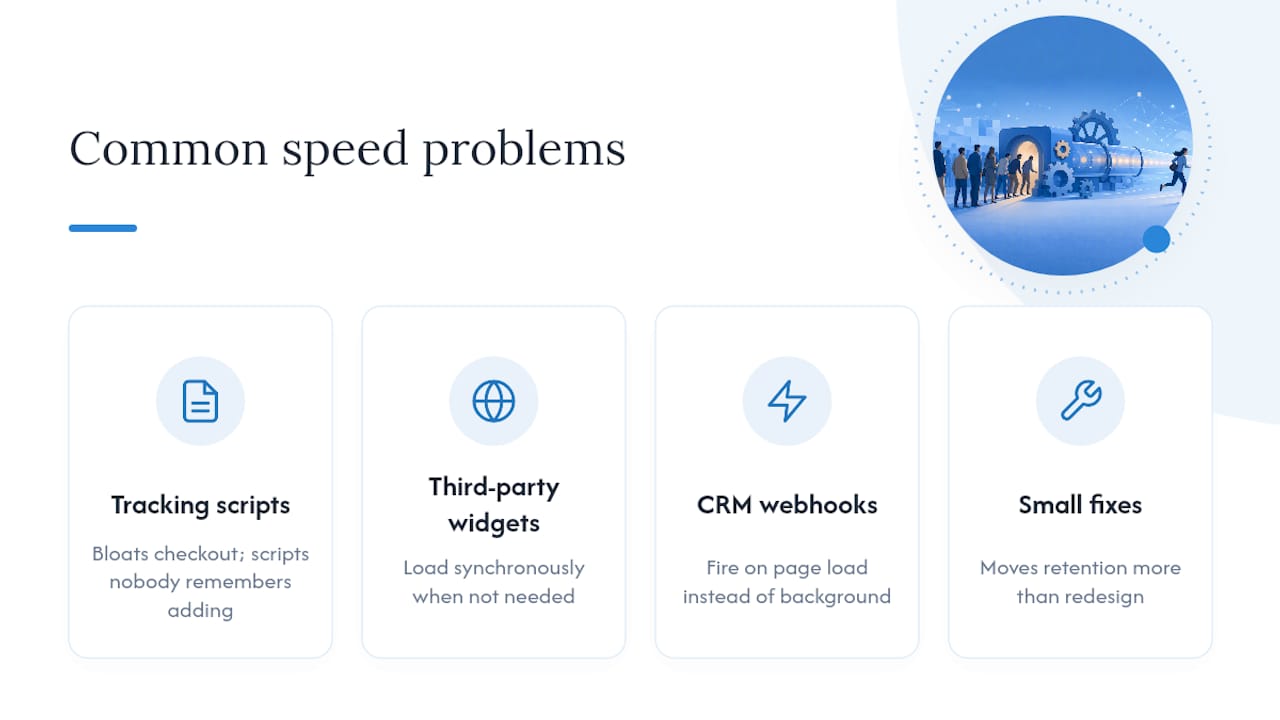
The same three problems show up on Cloud 9’s client audits again and again: a checkout page bloated with tracking scripts nobody remembers adding, third-party widgets loading synchronously when nothing about them needs to be, and CRM webhooks firing on page load instead of in the background. None of these are exotic. They’re just unnoticed until someone measures them.
What tends to surprise clients isn’t that speed matters, most people already sense that. It’s how disproportionately the checkout and lead-capture stages carry the cost, and how a fix that sounds boring, deferring one script, queuing one webhook, moves the retention needle further than a full visual redesign. Start by measuring your CRM and webhook latency this week. If nobody in your business can tell you that number today, that’s the first gap to close.
How Cloud 9 helps you stop losing customers to slow systems
Cloud 9 exists to fix exactly the problems this article covers, without you needing to hire a specialist for hosting, another for CRM automation and a third for frontend performance. Where most agencies hand you a page speed report and leave you to interpret it, Cloud 9 runs the audit, fixes the infrastructure, and manages the CRM automation layer under one roof, so the checkout latency, the webhook queue and the hosting configuration all get resolved by people who can see the whole chain.

Three places to start: a performance audit that traces frontend and backend latency together, managed cloud services that keep hosting and infrastructure from regressing after launch, and CRM and marketing automation support that catches synchronous calls and slow webhooks before they cost you conversions. If you already suspect your checkout or contact forms are bleeding customers, get a discovery call booked and let Cloud 9 map where the seconds are going.
Sources
- Harvard Business School faculty item — study on website speed and customer behaviour
- Milliseconds make millions (Think with Google / Deloitte research)
- Cloudflare — website performance and conversion rates
- LogicMonitor — web performance statistics (2026)
- Core Web Vitals conversion impact (SiteGrade)
FAQ
Why does response time affect retention so directly?
Slower response times increase abandonment and erode trust, and both feed churn because customers associate delay with unreliability, especially at checkout.
What is a good LCP or INP target?
Good LCP sits under 2.5 seconds and good INP sits under 200 milliseconds at the 75th percentile, which is the threshold most operator guides recommend.
Should I use RUM or synthetic testing?
Use both: synthetic testing catches regressions before release, while RUM shows what real visitors experience and updates faster than the 28-day CrUX window.
Why does CRM latency matter for retention if my website is fast?
A fast page with a slow synchronous CRM call still delays the action that matters, submitting a form or completing checkout, so it needs to be measured and fixed separately.
How quickly can fixing response time show up in retention data?
Businesses closing the gap to good LCP have recovered 15 to 40% of previously lost conversions, and staged rollouts over two to four weeks are usually enough to see the effect.