Website load time is the duration a browser takes to fully display a page’s content after a user requests it, and it directly determines whether visitors stay, convert, or leave. The role of website load time extends far beyond technical performance. It shapes user trust, search engine rankings, and business revenue in ways that compound over time. Google PageSpeed Insights and Core Web Vitals are the recognised industry standards for measuring this performance. Bounce probability rises by 32% as load time increases from one to three seconds. That single figure tells you everything about the stakes.
How does website load time affect user experience and behaviour?
Slow pages destroy trust before a visitor reads a single word. Users form an opinion about a website’s credibility within milliseconds of arrival, and a sluggish response signals an unreliable brand. Speed is not a technical nicety. It is a first impression.
The numbers are unambiguous. A 100ms delay reduces conversions by 7%, according to research from Google and Akamai. That is not a rounding error. For a site generating £50,000 per month, a single second of unnecessary delay costs thousands in lost revenue every year.

Mobile performance compounds the problem significantly. The average page load time is 8.6 seconds on mobile versus 2.5 seconds on desktop. Mobile users expect speed comparable to desktop, and most sites fail to deliver it. The gap between expectation and reality is where engagement dies.
Key ways slow load times damage user experience:
- Visitors abandon pages before content appears, increasing bounce rates sharply
- Users perceive slow sites as less trustworthy, reducing willingness to purchase or enquire
- Engagement metrics such as pages per session and time on site fall as frustration grows
- Repeat visits decline because users remember the poor experience
- Mobile users are disproportionately affected due to network variability and device constraints
Pro Tip: Focus on perceived speed first. Techniques like lazy loading images below the fold and inlining critical CSS make pages feel faster even before the full load completes, because users see meaningful content sooner.
What role does load time play in search engine optimisation?
Page speed is a confirmed Google ranking signal, and its influence on SEO operates through two distinct channels: direct ranking weight and crawl efficiency. Understanding both is necessary for any serious SEO strategy.
Google’s Core Web Vitals define the thresholds that matter. LCP, INP, and CLS measure loading speed, interactivity, and visual stability respectively. The targets are clear: LCP under 2.5 seconds, INP under 200 milliseconds, and CLS under 0.1. Pages that miss these thresholds face ranking penalties in competitive search results.
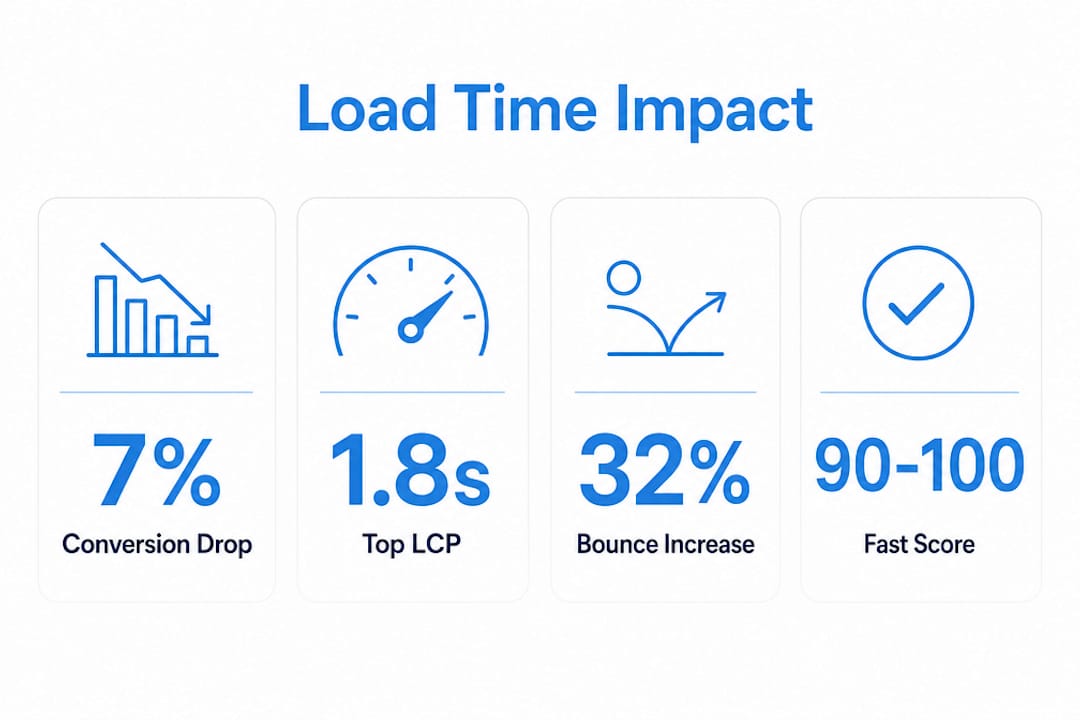
The correlation between speed and rankings is striking. Pages in the top three search results average an LCP of 1.8 seconds, compared to 3.4 seconds for lower-ranked pages. That 1.6-second gap is not coincidental. Faster pages earn better positions because Google uses real-world user experience data to inform its rankings.
Crawl efficiency is the less-discussed SEO benefit of fast servers. Faster server response times allow search engine bots to crawl more pages within the same crawl budget. For large sites with thousands of pages, this directly affects how quickly new content gets indexed. A slow server does not just frustrate visitors. It slows down the rate at which Google discovers and ranks your content.
A common misconception is that page speed only matters for the home page. In reality, Google measures Core Web Vitals across all URLs. A fast home page with slow product or service pages still produces poor field data and weakens overall domain performance.
| Core Web Vital | Metric | Good threshold |
|---|---|---|
| Largest Contentful Paint (LCP) | Loading speed | Under 2.5 seconds |
| Interaction to Next Paint (INP) | Interactivity | Under 200 milliseconds |
| Cumulative Layout Shift (CLS) | Visual stability | Under 0.1 |
How does website load performance influence conversion rates and revenue?
Website load performance is a direct revenue lever, not a background technical concern. The business case for speed investment is one of the clearest in digital marketing, because the data links milliseconds to money with unusual precision.
Deloitte Digital’s research is the most cited evidence in this space. A 0.1-second improvement in mobile speed increases conversions by 8.4% and average order value by 9.2%. That is a meaningful return from a change measured in fractions of a second. The implication is that speed improvements do not just attract more buyers. They also increase how much each buyer spends.
“The impact of speed is not limited to the checkout page. Delays at any stage of the purchase journey, from landing page to product page to basket, compound to reduce the probability of a completed transaction. Every second of friction is a reason to leave.”
The effect runs throughout the entire purchase journey, not just at the point of conversion. A visitor who waits too long on a landing page never reaches the product page. A user who experiences a slow basket page abandons before payment. Speed optimisation must address every step, not just the pages that receive the most traffic.
Treating speed as a one-off project is a costly mistake. Sites that pass a performance audit in january can degrade significantly by june as new features, plugins, and third-party scripts accumulate. Continuous monitoring is the only way to protect the revenue gains that speed improvements deliver.
Pro Tip: Set up automated Core Web Vitals monitoring through Google Search Console and review field data monthly. A sudden drop in LCP scores often signals a newly added script or image that has broken your performance budget.
What practical steps can website owners take to improve load time?
Improving website load performance requires a structured approach, not a list of one-off fixes. The most effective method starts with a performance budget and works outward from there.
- Set a performance budget. Blogs should target a maximum page weight of 200KB, while e-commerce sites should stay under 500KB with 30–40 HTTP requests. Without these limits, feature creep gradually adds scripts and images that degrade speed over months.
- Optimise images. Images are typically the largest contributor to page weight. Use modern formats such as WebP, compress files before upload, and apply lazy loading to images that appear below the fold.
- Inline critical CSS. Placing the CSS needed to render above-the-fold content directly in the HTML eliminates a render-blocking request. Inlining critical CSS improves perceived speed without removing any visual content.
- Defer non-critical JavaScript. Scripts that are not needed for the initial page render should load after the main content. Deferring JavaScript reduces the time to first meaningful paint and improves INP scores.
- Audit third-party scripts. Third-party scripts cause 30–60% performance regression even when the main site code is clean. Tag managers, chat widgets, and marketing pixels all compete for rendering resources. Remove any script that does not justify its performance cost.
- Implement HTTP/3 and Early Hints. DNS pre-fetch and HTTP 103 Early Hints reduce perceived load time by overlapping server processing with resource fetches. Early Hints alone can reduce LCP by 20–30% on supported servers.
- Use Google PageSpeed Insights regularly. A ‘Fast’ score on PageSpeed Insights requires a load time under two seconds and a performance score of 90–100. Run a full website performance audit at least quarterly to catch regressions before they affect rankings.
Pro Tip: Treat Core Web Vitals as build-breaking tests in your development workflow. If a code change causes LCP to exceed 2.5 seconds in testing, block the deployment until it is resolved. Prevention costs far less than recovery.
The site architecture decisions made at the design stage also determine how much performance headroom you have. A well-structured site with clean navigation and minimal render-blocking dependencies is far easier to keep fast than one built without performance in mind.
Key takeaways
Website load time directly controls user behaviour, search rankings, and conversion revenue, making speed optimisation one of the highest-return investments a website owner can make.
| Point | Details |
|---|---|
| Speed drives bounce rates | Bounce probability rises 32% when load time increases from one to three seconds. |
| Core Web Vitals set the standard | LCP under 2.5s, INP under 200ms, and CLS under 0.1 are Google’s thresholds for good performance. |
| Speed affects revenue directly | A 0.1-second mobile speed gain increases conversions by 8.4% and order value by 9.2%. |
| Performance budgets prevent decay | Set page weight limits by site type to stop gradual bloat from eroding speed gains. |
| Third-party scripts are a hidden risk | External scripts can cause 30–60% performance regression even when core code is clean. |
Why speed is an architectural commitment, not an afterthought
Most website owners treat performance as something to fix after launch. That is the wrong order. By the time a site goes live with a slow architecture, the cost of remediation is three to five times higher than building it correctly from the start.
The insight I keep returning to is this: performance engineering is an architectural discipline, not a checklist. Failure in even one pillar, whether that is image handling, script management, or server configuration, causes regressions that ripple through every metric. I have seen sites with excellent code destroyed by a single poorly configured tag manager.
Third-party scripts are the silent killers that most marketing teams never question. Every analytics tool, retargeting pixel, and live chat widget added without a performance review is a gamble with your load time. The cumulative weight of these additions is rarely visible until a PageSpeed audit reveals a score that has fallen from 85 to 52 over six months.
The sites that maintain strong performance over time share one habit: they treat speed as a product requirement, not a technical preference. Speed targets sit alongside design briefs and content plans from day one. That discipline compounds. A site that loads in 1.8 seconds in january and still loads in 1.8 seconds in december has a structural advantage over competitors who treat performance as a quarterly emergency.
— Rob
How Cloud 9 builds websites that stay fast
Cloud 9 works with established UK businesses that want websites built for performance from the ground up, not patched for speed after the fact. Every project targets a ‘Fast’ score on Google PageSpeed Insights, with Core Web Vitals treated as non-negotiable delivery criteria rather than optional extras.

Cloud 9’s web design and development service covers everything from architecture and image handling to script management and server configuration. The team also provides managed hosting with server environments configured for fast response times and efficient crawling. If your site is underperforming on speed, SEO, or conversions, Cloud 9 can identify exactly where the losses are occurring and build a plan to recover them. Get in touch to discuss a performance review tailored to your business.
FAQ
What is a good website load time?
Google PageSpeed Insights defines a ‘Fast’ score as a load time under two seconds with a performance score of 90–100. Pages ranking in the top three search results average an LCP of 1.8 seconds.
How does load time affect SEO rankings?
Google uses Core Web Vitals, including LCP, INP, and CLS, as direct ranking signals. Faster pages also allow search engine bots to crawl more content within the same crawl budget, improving indexing speed for larger sites.
What causes slow website load times?
The most common causes are unoptimised images, render-blocking JavaScript, excessive third-party scripts, and slow server response times. Third-party scripts alone can cause 30–60% performance regression even when core site code is clean.
Does mobile load time matter more than desktop?
Mobile load time carries greater commercial weight because the average mobile page takes 8.6 seconds to load against a user expectation of under three seconds. A 0.1-second improvement in mobile speed increases conversions by 8.4%.
How often should I audit my website’s load performance?
Run a full performance audit at least quarterly using Google PageSpeed Insights. Set up automated Core Web Vitals monitoring in Google Search Console to catch regressions between audits before they affect rankings or revenue.