The fastest way to stop manual reporting from eating your team’s week is to build a five-layer, automation-first workflow: automated collection, automated transformation, templated visualisation, scheduled delivery, and a human insight gate. That architecture is the spine of every scalable client reporting process, and you can start reducing manual time on your next report within the hour.
Three immediate actions to take right now:
- Audit one client account and list every data source that feeds the current report (GA4, Google Ads, CRM, spreadsheets).
- Create a shared metric dictionary document defining each KPI by name, source, calculation method, and owner.
- Pull one existing report template and mark every section that could be populated automatically versus every section that genuinely needs a human sentence.
Prerequisites before you build anything:
- Admin or API access to every data source for the pilot client
- A confirmed metric dictionary (even a rough one in a shared doc)
- One approved report template to parameterise
Pro Tip: Don’t try to automate everything at once. Pick your most time-consuming, most repeatable report and treat it as the pilot. One client, one report type, one clean run. That single success will do more to win internal buy-in than any proposal.
Key takeaways
A scalable client reporting workflow is built in five layers: automated collection, transformation, visualisation, delivery, and human insight. Skipping any layer creates a fragile process that breaks under scale.
| Point | Details |
|---|---|
| Five-layer architecture | Build collection, transformation, visualisation, delivery, and human insight as distinct, governed layers. |
| Start with a pilot | Run three to five clients through the full workflow before scaling; use a checklist-driven graduation process. |
| Metric dictionary first | Define every KPI in writing before building any connector or template; this prevents the most common client disputes. |
| Human gate is non-optional | No automated report should reach a client without a named human having approved it; assign data steward, owner, and approver roles. |
| Cloud 9 managed build | Cloud 9 implements end-to-end reporting workflows for UK agencies, with a working pilot in approximately four weeks. |
Table of Contents
- Why streamlined client reporting matters for agency growth
- What does a scalable five-layer reporting workflow look like?
- How do you automate data collection reliably?
- How should you transform and validate raw data?
- What should a reusable report template look like?
- How do you schedule and deliver reports without sending bad data?
- Where does human insight sit in an automated workflow?
- How do you move a client from manual to fully automated reporting?
- How do you choose the right KPIs for each client type?
- Which tools should UK agencies use for each workflow layer?
- How do you design an AI reporting agent with proper governance?
- Reusable report templates and cadence matrix you can copy
- What are the most common pitfalls before you go live?
- Lessons from implementing reporting for UK clients
- Cloud 9 handles the build so your team can focus on clients
- Sources
- FAQ
Why streamlined client reporting matters for agency growth
Manual reporting is a silent margin killer. An account manager spending three hours assembling a weekly performance report is not doing strategy, not spotting opportunities, and not building the client relationship that keeps a retainer alive. Multiply that across ten clients and you have lost a full working week every month to copy-paste.
Automating the end-to-end pipeline can free 5–15 hours per week across a reporting team once the workflow is properly built. That is not a marginal saving. For a mid-size UK agency, that is the equivalent of a part-time hire redirected into billable work.
The business case goes beyond hours, though. Three outcomes improve measurably when reporting quality rises:
- Decision speed: clients who receive clean, consistent data weekly make faster campaign decisions, which means fewer approval delays and faster spend deployment.
- Client confidence: a report that arrives on time, looks the same every week, and flags anomalies before the client notices them signals operational maturity. That signal is what keeps retainers renewing.
- Operational scalability: a templated, automated workflow means onboarding a new client adds hours of setup, not weeks of bespoke report-building.
Reporting quality is a retention signal. Clients rarely leave agencies because the campaigns underperformed. They leave because they felt uninformed. A consistent, well-structured report is one of the cheapest retention tools an agency has.
The measurement ROI is straightforward: track hours spent on reporting per client per month before and after automation, then multiply the difference by your blended hourly rate. Most agencies find the workflow pays for its build time within the first quarter.
What does a scalable five-layer reporting workflow look like?
Think of the workflow as a production line, not a one-off task. Each layer has a clear job, a clear owner, and a clear output. When one layer fails, the others hold.
The five layers:
- Automated collection — connectors and APIs pull raw data from every source on a schedule, with no human intervention.
- Automated transformation — ETL logic normalises, cleans, and calculates metrics from raw data into a consistent schema.
- Templated visualisation — parameterised dashboards and report templates populate automatically from the transformed data layer.
- Scheduled delivery — the finished report is distributed to the right people via the right channel at the right time, with validation checks before send.
- Human insight — an account manager reviews the output, adds context, flags anomalies, and writes the narrative that automation cannot.
A worked example: A weekly marketing KPI report for a UK ecommerce client flows like this. On Sunday night, connectors pull sessions and revenue from GA4, spend and ROAS from Google Ads, and order data from the CRM. The transformation layer calculates blended ROAS, cost per acquisition, and week-on-week deltas, normalising all figures to GBP and UK timezone. Looker Studio populates the branded template automatically. At 7:00 AM Monday, the report is validated, then emailed as a PDF with an interactive link. By 8:30 AM, the account manager has added two sentences of context about a bank holiday that skewed Sunday traffic. The client reads it at 9:00 AM before their weekly stand-up.
That is the target state. The sections below show you how to build each layer.
How do you automate data collection reliably?
Layer 1 is where most reporting workflows break. The connectors are unreliable, the credentials expire, or the data arrives in inconsistent formats. Getting this layer right is mostly a governance problem, not a technical one.
Connector types you need to cover:
- Analytics: GA4 (Universal Analytics is gone; if any client is still on it, that is your first migration task), Adobe Analytics
- Paid media: Google Ads, Meta Ads, LinkedIn Campaign Manager, Microsoft Advertising
- CRM and lead gen: HubSpot, Salesforce, Pipedrive
- Ecommerce: Shopify, WooCommerce, Magento
- Finance: Xero, QuickBooks (for cost and revenue reconciliation)
- Flat files: Google Sheets, CSV uploads for data that has no API
Tools like Supermetrics handle the connector layer well for most agency stacks, pulling from GA4, Google Ads, and social platforms into a central destination. For more complex multi-source pipelines, BigQuery as a warehouse destination gives you SQL-level control over the raw data before it reaches any visualisation layer. Power BI’s enterprise gateway handles scheduled refresh from both on-premises and cloud sources, which matters for UK clients who still hold data on local servers.
Access and credential checklist for each client:
- API keys or OAuth tokens for every connected platform
- Correct account IDs and property IDs (GA4 property ID, Google Ads customer ID)
- View-level or account-level permissions confirmed in writing
- Timezone setting confirmed (Europe/London for UK clients)
- Currency confirmed as GBP where applicable
- Data retention settings checked (GA4 defaults to 14 months; confirm this covers your reporting window)
Common mapping issues to resolve before build:
- Channel naming mismatches: “Paid Search” in GA4 may appear as “Google / CPC” in another tool. Standardise in the transformation layer, not the connector.
- Attribution window differences: Google Ads defaults to a 30-day click window; GA4 uses a different model. Document which window each metric uses.
- Date range alignment: confirm whether the client’s “week” runs Monday to Sunday or Sunday to Saturday. UK convention is Monday to Sunday.
Pro Tip: Before you build any connector, create a source map: a simple spreadsheet listing every data source, the tool used to connect it, the account ID, the credential owner, and the refresh frequency. This document becomes your first line of defence when a connector breaks at 6:00 AM on a Monday.
Also worth building into your digital ecosystem integration checklist from day one: a column for “last verified” so you know which credentials are stale before they cause a failed report.
How should you transform and validate raw data?
Raw data from connectors is almost never report-ready. Sessions from GA4 and sessions from a CRM are not the same metric, even if they share a name. Layer 2 is where you impose consistency.
Start with a metric dictionary. Before writing any transformation logic, define every metric in writing. A metric definition should capture its name, source platform, calculation method, ownership, any validity thresholds, and the applicable currency and timezone.
That definition becomes the contract between your data layer and your visualisation layer. Changes in definitions then propagate correctly to templates.
Transformation options by complexity:
| Approach | Best for | Tools |
|---|---|---|
| In-tool transforms | Simple calculations, single source | Looker Studio, Power BI calculated columns |
| ETL middleware | Multi-source joins, scheduled runs | Supermetrics, Make (Integromat), Zapier |
| Warehouse SQL | Complex logic, audit trail, scale | BigQuery, dbt |
For most UK agencies handling 10–50 clients, a combination of Supermetrics for connectors and BigQuery for transformation gives the best balance of speed and control. Separating the data layer from the intelligence and delivery layers is the architectural decision that makes the whole system maintainable. When the LLM or the dashboard template changes, the data layer does not need to change with it.
Validation checklist before data reaches the visualisation layer:
- No null values in primary KPIs (sessions, spend, revenue, leads)
- Date range matches the expected reporting window
- Currency is GBP throughout (or explicitly labelled if multi-currency)
- Timezone is Europe/London for all timestamp-based metrics
- Week-on-week delta is within a plausible range (flag anything above ±50% for human review)
- Row counts match expected volume (a sudden drop to zero rows is a connector failure, not a performance drop)
Pro Tip: During the first four weeks of any new automated pipeline, run the automated report and the manual report in parallel. Compare them line by line. The discrepancies you find in that parallel run are the transformation bugs you would otherwise discover when a client spots them first.
What should a reusable report template look like?
A good report template has four panels, and each panel has a defined job. The goal is that any account manager can pick up any client’s report and know exactly where to look for what.
The four-panel structure:
- Panel 1 — Executive summary: Three to five headline metrics with period-on-period comparison. No charts. Just numbers and direction arrows. This is the panel the client reads in the first five seconds.
- Panel 2 — Channel performance: One section per active channel (paid search, organic, paid social, email). Each section shows spend or effort, output metric, and efficiency metric. Charts live here.
- Panel 3 — Anomalies and alerts: Any metric that triggered a threshold alert this period, with a one-line explanation. This panel is empty when everything is normal, which itself is a signal.
- Panel 4 — Recommendations and next steps: Two to four bullets written by the account manager. This is the only panel that cannot be automated.
The fundamental three-step report workflow of gathering data, designing components, and scheduling delivery maps directly onto panels 1–3 being automated and panel 4 being the human gate.
Power BI and Looker Studio both support parameterised templates where a single template file serves multiple clients by swapping the data source or filter. Looker Studio’s “Report Filters” and Power BI’s “Row-Level Security” handle client isolation within a shared template.
What each panel should contain:
Sample commentary for account managers to adapt:
- “Paid search CPA rose 18% this week, driven by increased competition on brand terms following [Competitor X]’s new campaign. We are testing a bid adjustment on exact match to recover efficiency by next week.”
- “Organic sessions are down 12% week-on-week. This aligns with the bank holiday on Monday and is consistent with the same period last year. No action required.”
These snippets are not filler. They are the reason the client trusts the report.
How do you schedule and deliver reports without sending bad data?
Delivery is the layer most agencies treat as an afterthought, and it is where the most visible failures happen. A report that arrives late, arrives with broken formatting, or arrives with a metric that is obviously wrong does more damage to client trust than no report at all.
Cadence decision matrix:
| Client type | Recommended cadence | Format | Rationale |
|---|---|---|---|
| Performance marketing (PPC/paid social) | Weekly | PDF + interactive link | Spend decisions need weekly visibility |
| B2B lead gen | Biweekly | PDF email | Lead cycles are longer; weekly is noise |
| Ecommerce | Weekly or daily dashboard | Interactive portal | Revenue fluctuates daily; dashboard preferred |
| SEO / content | Monthly | PDF email | Rankings move slowly; monthly is sufficient |
| Executive stakeholder | Monthly | One-page PDF | Executives want summary, not channel detail |
Operational reporting falls into four types: real-time, periodic, historical trends, and ad hoc. Each type carries different validation tolerances. A real-time dashboard can show a one-hour data lag; a monthly PDF report should never have a data gap.
Delivery channels and their trade-offs:
- PDF email: universal, archivable, no login required. Downside: static, no drill-down.
- Interactive link (Looker Studio, Power BI): clients can explore data themselves. Downside: requires a login or public link, which raises data security questions.
- Client portal: branded, centralised, professional. Downside: setup cost and client adoption friction.
- Slack: fast, conversational, good for weekly snapshot summaries. Downside: not archivable in a client-friendly way; inappropriate for formal reporting.
Tools like Rollstack can automatically sync data into reports and presentations, which is useful when clients expect a PowerPoint or Google Slides format rather than a dashboard link.
Delivery fail-safes to build in:
- Automated validation hold: if any primary KPI is null or outside a defined threshold range, the report is held and a Slack or email alert is sent to the account manager, not to the client.
- Retry logic: if the data pull fails, the system retries three times before escalating to a human.
- Distribution list sanity check: confirm the recipient list against the client’s current contacts before each send. People leave; stale distribution lists are a data breach risk.
Where does human insight sit in an automated workflow?
Automation handles the data. Humans handle the meaning. That distinction is not a limitation of the technology; it is a deliberate design choice that protects the agency’s value and the client’s trust.
Review responsibilities that must stay human:
- Spot-checking three to five data points per report against the source platform (do the GA4 sessions in the report match what you see in GA4 directly?)
- Reading the narrative for tone, accuracy, and relevance to current campaign activity
- Adding context that the data cannot carry: a product launch, a PR story, a competitor move, a seasonal event
- Confirming the anomaly panel reflects real events, not data errors
A three-line insight chip an account manager might add:
We will resend the top-performing content on Wednesday to recover reach."
That chip takes two minutes to write. It is the sentence that makes the client feel understood.
Pre-send role assignments:
- Data steward (analyst or ops): runs the validation checklist, confirms no nulls, confirms date ranges, signs off the data layer.
- Account manager (owner): reads the full report, writes panel 4, adds insight chips to the anomaly panel, approves send.
- Account director (approver): reviews reports for new clients or any report flagged by the validation hold. Signs off before the first three sends of any new automated pipeline.
This three-role structure means no report reaches a client without at least one human having read it end to end.
How do you move a client from manual to fully automated reporting?
The transition from manual to automated reporting is a project, not a switch. Rushing it is the single most common reason automations fail in the first month.
Phase-by-week transition plan:
| Phase | Weeks | Activities | Exit criteria |
|---|---|---|---|
| Discovery | 1–2 | Audit data sources, collect credentials, build source map, define metric dictionary | Source map complete, all credentials confirmed |
| Pilot build | 3–4 | Build connectors, transformation logic, and template for one client | Automated report generated successfully |
| Parallel run | 5–6 | Run automated and manual reports side by side; compare line by line | Fewer than 2% discrepancy on primary KPIs |
| Validation | 7 | Run validation checklist; get sign-off from data steward and account director | Checklist passed, sign-off recorded |
| Go-live | 8 | Switch to automated delivery; manual report retired | First automated report sent and acknowledged by client |
| Scale | 9–12 | Onboard next 3–5 clients using the same template and connector set | Each new client passes validation before go-live |
Validation checklist before accepting the automation:
- Primary KPIs match manual report within 2%
- No null values in any metric field
- Date ranges align exactly with the reporting period
- Currency and timezone are correct throughout
- Anomaly detection triggered correctly on at least one test case
- Distribution list confirmed and tested with a dummy send
- Account manager has reviewed and approved the first three automated outputs
An AI-assisted SOP can reduce reporting time significantly when it includes explicit validation steps and a mandatory human approval gate. The SOP is not a shortcut around the checklist; it is the checklist, formalised.
Pro Tip: Start with a pilot cohort of three to five clients, chosen for data cleanliness and reporting simplicity. Do not pick your most complex client for the first run. Graduation to the next cohort should be checklist-driven: metric parity confirmed, reviewer sign-off recorded, anomaly behaviour tested.
Automating ecommerce reporting follows the same phased approach; Cloud 9’s ecommerce reporting automation guide shows a worked example for UK SMEs.
How do you choose the right KPIs for each client type?
The most common reporting mistake is including too many metrics. A report with twenty-two KPIs is a report where the client cannot tell you what the most important number is. The target is three to eight metrics that survive the five-second test: a client should be able to read the executive summary in five seconds and know whether the week was good or bad.
Three client types with suggested KPIs:
- Performance marketing (PPC/paid social): ROAS, cost per acquisition, click-through rate, impression share. Secondary: quality score, conversion rate by device.
- B2B lead gen: Marketing-qualified leads (MQLs), cost per MQL, lead-to-opportunity rate, pipeline value influenced. Secondary: form completion rate, email open rate.
- Ecommerce: Revenue, average order value, conversion rate, return on ad spend, cart abandonment rate. Secondary: new vs. returning customer split, product category performance.
Building a KPI template checklist — fields to capture per metric:
- Metric name (canonical, as it appears in the report)
- Definition (exact calculation, no ambiguity)
- Data source (platform and field name)
- Owner (who is accountable for this number)
- Reporting frequency (weekly, monthly)
- Threshold (what triggers an alert)
- Target (what good looks like for this client)
- Notes (known data quirks, attribution caveats)
Executive vs. operational report scope:
Executive reports go to the client’s director or CEO. They should contain five metrics maximum, period-on-period comparison, and one paragraph of narrative. No channel breakdowns, no technical metrics. Operational reports go to the client’s marketing manager. They can contain channel-level detail, conversion funnel data, and testing results. The same underlying data feeds both; the template controls the scope.
Which tools should UK agencies use for each workflow layer?
The right tool depends on where you are in the maturity curve and how many clients you are managing. There is no single stack that wins every scenario.
Tool matrix by layer:
Warehouse-first vs. connector-first:
For agencies managing more than fifteen clients or handling multi-channel data with complex attribution, a warehouse-first approach using BigQuery as the central data store gives you SQL-level control, an audit trail, and the ability to serve multiple visualisation tools from one source. The setup cost is higher, but the long-term maintenance cost is lower.
For agencies under fifteen clients or those starting their first automation build, a connector-first approach using Supermetrics feeding directly into Looker Studio or Power BI gets you to a working report faster. You can migrate to a warehouse layer later without rebuilding the visualisation templates.
One-line setup estimates:
- GA4 + Looker Studio (single client): one to two days
- Supermetrics + Looker Studio (five clients, standard template): three to five days
- BigQuery + dbt + Looker Studio (multi-client, warehouse): two to four weeks
- Make or Zapier orchestration layer: one to three days per workflow
For UK agencies, prefer cloud warehouses or managed connectors that support GBP and Europe/London timezone normalisation natively. Currency and timezone mismatches are the most common source of client-facing errors in multi-source reports.
Cloud 9’s CRM and marketing automation services cover the integration layer for agencies that need CRM data feeding into reporting pipelines alongside GA4 and paid media sources.
How do you design an AI reporting agent with proper governance?
An AI reporting agent is not a chatbot that writes reports. It is a structured system with defined inputs, defined rules, and defined escalation paths. The distinction matters because an agent without guardrails will eventually send a hallucinated metric to a client.
Starter agent blueprint (copy and adapt):
- Role: You are a reporting agent for a UK digital marketing agency. Your job is to pull metrics from the data layer, identify anomalies, draft narrative summaries, and route outputs for human review before delivery.
- Tools: Data warehouse query (BigQuery), anomaly detection module, report template renderer, Slack notification, email delivery.
- Rules: Never send a report to a client without a human approval flag set to TRUE. Never interpret a null value as zero. Always state the reporting period and data source for every metric.
- Scenario playbook: If a primary KPI is null, hold the report and alert the data steward via Slack. If a metric delta exceeds ±30%, flag it in the anomaly panel and route to the account manager for a one-line explanation before send. If the data pull fails three times, escalate to the account director.
- Decision logic: Anomaly detection runs before the LLM narrative step. Pre-compute z-scores or threshold comparisons on the transformed data, then pass flagged items into the prompt so the model explains real signals rather than generating plausible-sounding ones.
- Guardrails: No client data passes through a free-tier LLM. Each client’s data is isolated at the query level. All outputs are logged with a timestamp and the approver’s name before delivery.
Escalation playbook template:
- Trigger: Primary KPI null or delta exceeds threshold
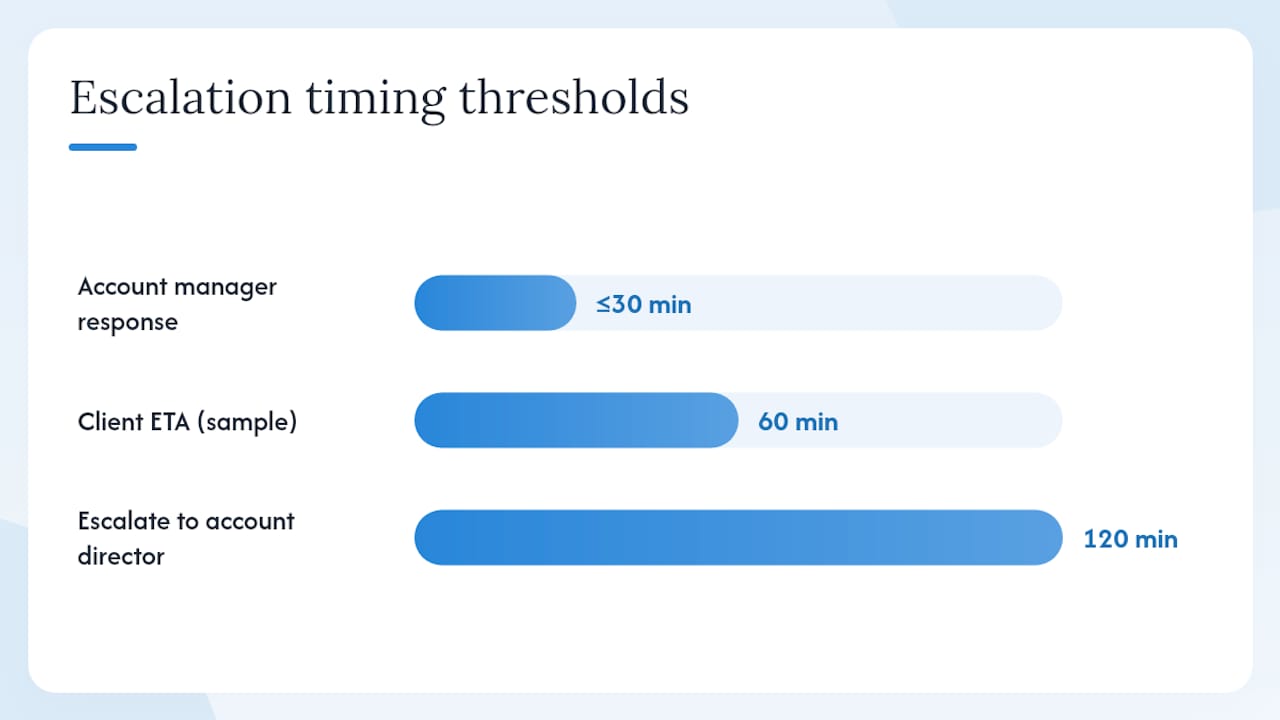
- Who to notify: Data steward (immediate), account manager (within 30 minutes)
- Sample 5-second summary message: “HOLD: [Client name] weekly report. Sessions null for 3 Nov. Connector failure suspected. Data steward reviewing. ETA: 60 minutes.”
- Routing rule: If unresolved after two hours, escalate to account director. Client receives a brief delay notification from the account manager, not from the system.
UK compliance guardrails:
- Data minimisation: the agent queries only the fields needed for the current report. No bulk exports of raw user data.
- No free-tier LLMs: free tiers of tools like ChatGPT or Gemini may use inputs for model training. Use enterprise API access with data processing agreements in place.
- Per-client data isolation: BigQuery row-level security or separate datasets per client. Never run a query that could return data from multiple clients in one result set.
- UK GDPR: confirm that any third-party tool in the pipeline has a UK-compliant data processing agreement. Post-Brexit, the UK GDPR is the governing framework, not the EU GDPR, though they are substantially equivalent.
The recommended separation of data layer, intelligence layer, and delivery layer is the architectural principle that makes compliance auditable. When each layer has a clear boundary, you can demonstrate to a client exactly where their data goes and who touches it.
Pro Tip: Pre-compute anomaly detection before calling any LLM. Pass the flagged items into the prompt with their context. A model that is given raw data and asked to spot anomalies will sometimes invent them.
The Rework reporting agent blueprint provides a copy-paste starter for the agent role, rules, and handoff triggers that you can adapt directly to your stack.
Reusable report templates and cadence matrix you can copy
A template is only reusable if it is parameterised. A template that requires manual editing for each client is not a template; it is a starting point. The goal is a file where swapping the client filter or data source connection changes every number automatically.
Executive summary template snippet:
Weekly Performance Summary — [Client Name] — Week of [Date]
- Total revenue: £[X] ([+/-X%] vs prior week)
- Total ad spend: £[X] ([+/-X%] vs prior week)
- Blended ROAS: [X.X] (target: [X.X])
- Total leads / MQLs: [X] ([+/-X%] vs prior week)
- Key win this week: [Account manager writes one sentence]
Cadence decision matrix:
| Client need | Frequency | Format | Distribution |
|---|---|---|---|
| Active paid media management | Weekly | PDF + interactive link | Email to marketing manager |
| SEO and content performance | Monthly | PDF email | Email to marketing lead and director |
| Ecommerce revenue tracking | Weekly or daily | Interactive dashboard | Portal or shared link |
| Executive board reporting | Monthly | One-page PDF | Email to director only |
| Ad hoc campaign analysis | On request | PDF or slide deck | Agreed per request |
Distribution checklist for each template variant:
- Recipient list reviewed and confirmed within the last 30 days
- Report period dates confirmed correct before send
- Validation hold check passed (no nulls, no threshold breaches)
- Account manager has reviewed panel 4 and added narrative
- Subject line includes client name, report period, and report type
- PDF is tested for rendering on mobile (many clients read reports on their phones)
What are the most common pitfalls before you go live?
Most reporting automation failures are predictable. They happen because teams skip the pre-flight checks in the rush to go live. Run this checklist before flipping the switch on any new automated pipeline.
10-item pre-flight checklist:
- Source map complete: every data source listed with connector, account ID, and credential owner.
- Metric dictionary signed off: every KPI defined, calculated, and agreed with the client.
- Timezone confirmed as Europe/London for all timestamp-based metrics.
- Currency confirmed as GBP throughout, or explicitly labelled if multi-currency.
- Attribution windows documented for every paid media source.
- Validation thresholds set for every primary KPI (null check, delta check).
- Distribution list tested with a dummy send to an internal address.
- Access permissions confirmed: the service account or API token has read-only access, not admin.
- Parallel run completed: automated and manual reports compared for at least two reporting periods.
- Sign-off recorded: data steward and account manager have both approved the first automated output.
Red flags that should pause a rollout:
- Metric nulls on primary KPIs: a null is never a zero. It means the connector failed or the field mapping is wrong. Do not go live until the root cause is confirmed.
Mitigation: add a null check to the validation layer that holds the report and alerts the data steward. - Large unexplained deltas (greater than ±30% week-on-week): could be a genuine performance shift or a data error. You cannot tell without investigating.
Mitigation: route any report with an unexplained delta above threshold to the account manager for a one-line explanation before send. - Mismatched attribution windows: Google Ads and GA4 will show different conversion numbers for the same period if their attribution windows differ. Presenting both without explanation confuses clients.
Mitigation: document the attribution model for each metric in the report header and use one source of truth per metric. - Stale credentials: OAuth tokens expire. API keys get rotated. A connector that worked last week may fail silently this week.
Mitigation: build a credential health check into the weekly pre-send validation. Alert the data steward if any token is within 14 days of expiry. - Wrong reporting period: a report labelled “Week of 3 November” that actually contains data from 27 October to 2 November is a factual error.
Mitigation: include the exact date range in the report header, pulled dynamically from the data layer, not typed manually.
Lessons from implementing reporting for UK clients
The most consistent lesson from rolling out automated reporting for UK clients is that the data governance conversation is harder than the technical build. Getting a client to confirm their GA4 property ID, their attribution model preference, and their definition of a “lead” takes longer than connecting the API. Agencies that skip that conversation and build first end up rebuilding.
One pattern that comes up repeatedly: a client’s marketing manager and their sales director have different definitions of what counts as a conversion. The marketing team counts form fills; the sales team counts qualified calls. When the automated report shows “conversions” without specifying which definition it uses, both sides read it differently and the agency gets caught in the middle. A metric dictionary, agreed in writing before the build starts, prevents that entirely.
On UK-specific presentation: always display monetary figures in GBP with the £ symbol, and always label the VAT status of any revenue figure (gross or net of VAT). UK clients, particularly ecommerce businesses, will immediately question a revenue figure that does not match their Xero or QuickBooks dashboard. The discrepancy is almost always VAT. State it in the report header.
For agencies starting their first pilot: choose a client who already trusts you, whose data is clean, and who will give you honest feedback if something looks wrong. A client who flags a discrepancy is doing you a favour. A client who silently stops reading the report is not.
Cloud 9 handles the build so your team can focus on clients
Agencies that want the outcome of automated reporting without the six-to-twelve weeks of internal build time have a practical alternative. Cloud 9 designs and implements end-to-end reporting workflows for UK agencies and established businesses, covering connector setup, transformation logic, templated dashboards, and scheduled delivery. The build is managed, the templates are yours to keep, and the ongoing support means a broken connector at 6:00 AM on a Monday does not become your problem.
A typical Cloud 9 reporting implementation covers a pilot of three to five clients, with a working automated report within four weeks. That includes source mapping, metric dictionary, Looker Studio or Power BI template, validation logic, and delivery configuration. Ongoing support covers credential renewals, connector updates, and template changes as client needs evolve. Cloud 9’s AI automation services extend this into agent-based reporting for agencies ready to add LLM-assisted narrative and anomaly detection to their workflow. To discuss a managed implementation for your agency, get in touch with Cloud 9 and describe your current reporting stack and client volume.
Sources
- How to Create an AI Report Generation Workflow | Zarif Automates
- Tutorial: the report workflow — Inductive Automation docs
FAQ
How do you create a client report?
Define the client’s goals and KPIs first, then connect the relevant data sources, populate a parameterised template, and schedule delivery with a human review gate before send. The five-layer workflow (collection, transformation, visualisation, delivery, insight) is the most reliable structure for repeatable, scalable reports.
What are the key elements of a well-structured report?
An effective client report needs a clear executive summary, channel-level performance data with period-on-period comparisons, an anomaly or alerts section, and a recommendations panel written by the account manager. Every metric should have a defined source and calculation method agreed in advance.
What types of operational reporting should agencies know about?
Operational reporting falls into four types: real-time, periodic, historical trends, and ad hoc. Each requires different delivery choices and validation tolerances. Most agency client reports are periodic (weekly or monthly), but ecommerce clients often benefit from a real-time or daily dashboard alongside the periodic summary.
How do you automate the reporting process?
Build a data pipeline that connects sources (GA4, Google Ads, CRM) via connectors or APIs, transforms raw data into consistent metrics in a warehouse or ETL tool, and populates a parameterised template on a schedule. Add validation checks that hold the report if any primary KPI is null or outside a threshold, and require a human approval before delivery. Tools like Supermetrics, BigQuery, Looker Studio, and Make (Integromat) cover the main layers for most UK agency stacks.
How does Cloud 9 help agencies build reporting workflows?
Cloud 9 designs and implements end-to-end reporting workflows for UK agencies, covering source mapping, transformation logic, dashboard templates, and scheduled delivery. A typical pilot covers three to five clients with a working automated report within approximately four weeks, including ongoing support for connector maintenance and template updates.