For most UK agencies and in-house teams, the choice comes down to two routes: a purpose-built client reporting platform for fast, white-labelled delivery, or a managed reporting partner that handles integration, maintenance, and UK-based support. Neither is universally right. The tool you pick depends almost entirely on how much engineering capacity you have and how many clients you need to scale across.
Quick shortlist:
- Best overall for agencies: Whatagraph — rapid white-label setup, polished PDF outputs, minimal engineering
- Best for small agencies: AgencyAnalytics — per-client pricing, fast onboarding, credible white-label portals
- Best free/self-serve option: Looker Studio — infinitely customisable, but budget for connector costs and engineering hours
- Best for enterprise/warehouse-first: Microsoft Power BI or Funnel.io — deep modelling, governance, and reliable connector infrastructure
- Best managed partner (UK): Cloud 9 — fully managed reporting retainer with UK support, integrated automation, and no internal engineering overhead
The managed partner route suits teams that want reporting delivered as an outcome, not a project. Cloud 9 combines dashboard integration, CRM and analytics automation, and ongoing UK support under one retainer, which removes the connector maintenance burden that quietly erodes margins on self-serve tools.
Table of Contents
- How do these client reporting dashboard tools compare?
- How did we select and test these tools?
- What does each tool actually deliver for client reporting?
- How to choose the right client reporting dashboard for your team
- What does each tool class cost, and how long until your first report?
- What is a client reporting dashboard, and should you build, buy, or outsource?
- When is Cloud 9 the better choice for UK teams?
- Key takeaways
- The hidden cost of “free” tools is usually someone’s time
- Cloud 9 takes the engineering burden out of client reporting
- Useful sources and vendor links
- FAQ
How do these client reporting dashboard tools compare?
The table below covers the dimensions that matter most in a buying decision: use case fit, pricing shape, connector depth, setup effort, white-label capability, and UK support availability.
| Tool | Best for | Pricing band | Connectors / integrations | Ease of setup | White-label / client outputs | Portfolio / multi-client | UK support |
|---|---|---|---|---|---|---|---|
| Cloud 9 | UK teams wanting fully managed reporting with no engineering overhead | Managed retainer (bespoke) | Custom integrations built and maintained by Cloud 9 | Handled by Cloud 9 | Yes — white-label delivery included | Yes — multi-client managed | UK-based |
| Whatagraph | Agencies needing polished, scheduled client reports fast | Mid-tier SaaS | 34+ | Very easy | Strong white-label PDF/deck outputs | Yes | Email/chat |
| AgencyAnalytics | Small agencies, per-client pricing | Entry SaaS | 80+ integrations | Easy | White-label client portals | Yes | Email/chat |
| DashThis | Agencies prioritising template cloning and scheduled reports | Entry–mid SaaS | 34+ connectors | Easy | Yes | Yes — template cloning | |
| Looker Studio | Teams with engineering capacity, low licensing cost | Free (connector costs extra) | Native Google; third-party via paid connectors | Moderate–high engineering | Limited native; custom via build | Manual per client | Community |
| Microsoft Power BI | Microsoft 365 / Azure enterprises | Per-user or Premium capacity | — | Moderate–high | Limited native white-label | Yes with Premium | Enterprise SLA |
| Tableau | Data teams needing complex visualisations | Mid–enterprise | Broad connector library | High | Limited | Yes | Enterprise SLA |
| Databox | Marketing/sales KPI monitoring, mobile-first | Entry SaaS | 80+ | Easy | Limited | Basic | Email/chat |
| Domo | Large teams, embedded analytics | Enterprise | 1,000+ connectors | High | Yes — embedded options | Yes | Enterprise SLA |
| Funnel.io | Enterprise connector/data-layer needs | Enterprise | 500+ marketing sources | High (ETL setup) | No (feeds BI tools) | Yes | Enterprise |
| Klipfolio | SMB real-time KPI dashboards | Entry–mid SaaS | 80+ | Moderate | Limited | Basic | Email/chat |
| ThoughtSpot | Search-driven, conversational analytics | Enterprise | Broad warehouse connectors | High | Limited | Yes | Enterprise SLA |
| Grow.com | Executive dashboards, mid-market | Mid SaaS | 150+ | Moderate | Limited | Basic | Email/chat |
| Teamwork.com | Agencies with project/time reporting needs | Entry–mid SaaS | Project-focused | Easy–moderate | Limited | Yes | Email/chat |
| Supermetrics | Flexible extraction to Sheets/BigQuery/Looker Studio | Entry–mid SaaS | 80+ marketing sources | Moderate | No (extraction only) | Yes | |
| Zoho Analytics | SMB teams, budget BI | Entry SaaS | — | Easy–moderate | Limited | Basic | Email/chat |
| Geckoboard | Operations teams, live status boards | Entry SaaS | 80+ | Very easy | Limited | Basic | |
| Porter Metrics | Cross-channel campaign reporting | Entry SaaS | 30+ marketing | Easy | Basic | Basic | |
| Improvado | Enterprise ETL, warehouse-first | Enterprise | 500+ | High (ETL project) | No | Yes | Enterprise |
| Datapine | Mid-market self-service BI | Mid SaaS | Broad DB connectors | Moderate | Limited | Basic | Email/chat |
| Coupler.io | Spreadsheet-based reporting, small teams | Entry SaaS | — | Very easy | No | No | |
| Cometly | Multi-channel marketing summaries | Entry SaaS | Marketing-focused | Easy | Basic | Basic | |
| Metrics Watch | KPI alerting and threshold monitoring | Entry SaaS | Marketing-focused | Easy | Basic | Basic | |
| Cyfe | One-dashboard overview, small teams | Entry SaaS | 80+ | Easy | Limited | Basic | |
| 1ClickReport | Automated PDF reports for agencies | Entry SaaS | Marketing-focused | Very easy | Yes — PDF automation | Basic | |
| ProWorkflow | Project/time reporting for agencies | Entry–mid SaaS | Project-focused | Easy–moderate | Limited | Basic | |
| Integrate.io | Warehouse-first ETL/ELT | Mid–enterprise | Broad cloud sources | High (ETL project) | No | Yes | Email/enterprise |
| Sisense | Embedded analytics, developer-led | Enterprise | Broad | High | Yes — embedded | Yes | Enterprise SLA |
| HubSpot | SMB/mid-market CRM + marketing reporting | Entry–enterprise | HubSpot ecosystem + 1,000+ via integrations | Easy | Limited | Basic | Email/chat/phone |
| Salesforce | Enterprise CRM and pipeline reporting | Enterprise | Salesforce ecosystem | High | Limited | Yes | Enterprise SLA |
| Google Analytics | Web traffic and behaviour reporting | Free | Google ecosystem | Easy | No | No | Community |
After scanning this table, a clear pattern emerges. Tools in the “very easy” setup column — Whatagraph, DashThis, AgencyAnalytics, Geckoboard, Coupler.io, 1ClickReport — are purpose-built for delivery speed. Tools in the “high” column — Funnel.io, Improvado, Tableau, Domo, Integrate.io — are infrastructure plays that require engineering investment before a single client sees a dashboard. Looker Studio sits awkwardly in the middle: free to licence, but the engineering hours and connector costs are often the single most important practical consideration for agencies once you factor in token expiry and maintenance.
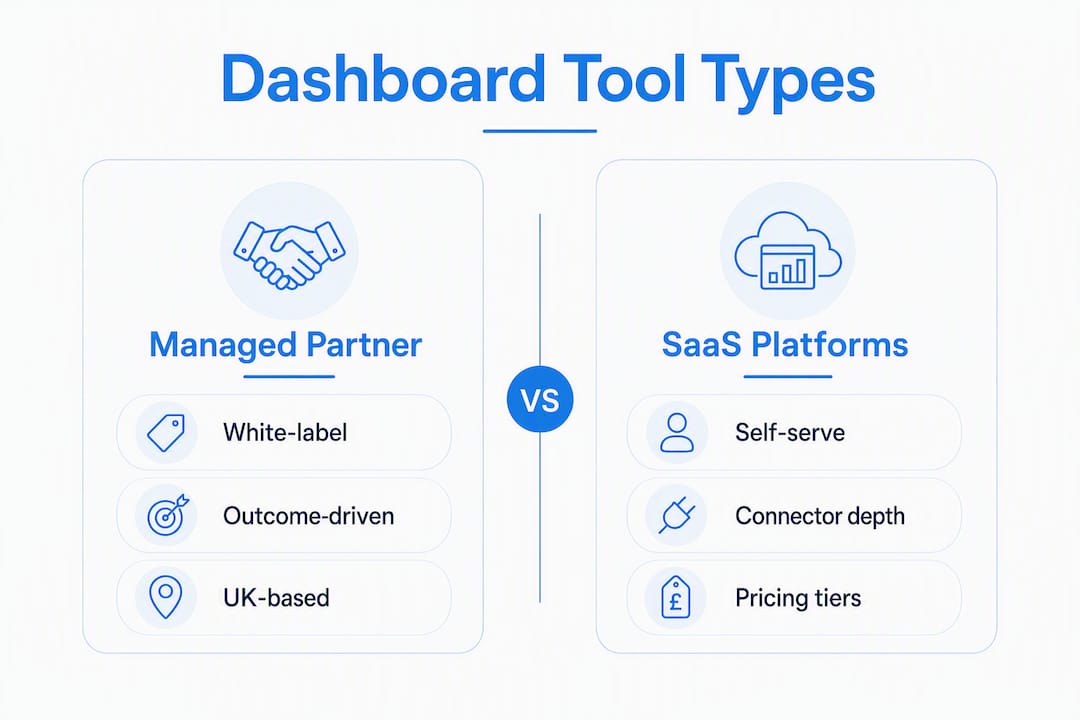
The managed partner case applies when your team sits in neither camp: you want reliable, white-labelled delivery but lack the engineering resource to maintain connectors at scale.
How did we select and test these tools?
The shortlist and rankings in this comparison were built on a consistent set of criteria, weighted to reflect what UK agency teams and in-house reporting leads actually care about in day-to-day operations.
Evaluation criteria (in priority order):
- Connector reliability and maintenance burden — does the tool handle token refresh, deduplication, and source changes without manual intervention? This was weighted highest because connector failures are the most common operational breakdown in agency reporting stacks.
- Client-ready outputs and white-labelling — can you deliver a branded, polished report or dashboard to a client without exporting to a third tool?
- Multi-client / portfolio management — template cloning, per-client permissions, and bulk scheduling matter enormously once you exceed ten clients.
- Automation and scheduling — scheduled PDF delivery, alerting on threshold breaches, and refresh cadence.
- Ease of setup and ongoing maintenance — time to first report for a new client account, and the engineering skill level required.
- Security and compliance — GDPR-relevant data residency options, SOC 2 certification where published, and role-based access controls.
- UK support availability — whether the vendor offers UK-hours support, a named account manager, or only asynchronous community help.
Data sources: product documentation, vendor pricing pages, practitioner comparison posts, and G2/Capterra review data. Connector counts were taken from vendor-published integration directories at the time of writing. Pricing bands reflect publicly listed plans; enterprise pricing requires direct negotiation with vendors.
Exclusion note: Platforms where the primary use case is internal BI or embedded analytics for software products (Sisense, ThoughtSpot, Domo) were included in the table for completeness but placed in the enterprise band. They are not practical first choices for agencies reporting to external clients on marketing and operational KPIs.
What does each tool actually deliver for client reporting?
Agency reporting tools split into three practical categories: purpose-built marketing reporting platforms, broader BI and dashboard platforms, and free general-purpose options that require significant engineering. The reviews below follow that structure.
Managed reporting partner
Cloud 9 (managed reporting) is not a SaaS product you licence and configure yourself. It is a UK-based managed service where Cloud 9 builds, maintains, and delivers your reporting infrastructure as part of a retainer. That distinction matters for teams that have tried self-serve tools and found the connector maintenance, template updates, and client onboarding eating into billable hours. Cloud 9 handles integration with sources including Google Analytics, CRM platforms, ecommerce systems, and Microsoft 365, and delivers white-labelled outputs without the client team touching a connector. UK-based support and data residency guidance are included. The trade-off is that it is not a tool you can spin up on a free trial — it requires a scoping conversation and a services agreement.
Best for: Established SMEs, membership organisations, and agencies that want reporting delivered as a managed outcome, not a software project.

Purpose-built client reporting platforms
Whatagraph is the closest thing to a turn-key agency reporting tool. It positions itself as an easy, pre-built client dashboard solution with rapid onboarding and white-label outputs, and that description holds up. You can have a branded client report live within hours of connecting your first data source. The limitation is that it is optimised for polished delivery, not deep data exploration — if a client wants to drill into raw data or build custom models, Whatagraph is not the right surface.
Pricing: Mid-tier SaaS; publicly listed plans with per-user and per-client options. Limitation: Connector depth is narrower than enterprise ETL tools.
AgencyAnalytics targets small agencies with per-client pricing that scales predictably. White-label client portals, 80+ integrations, and fast onboarding make it a credible entry point. It lacks the data modelling depth of Power BI or the connector reliability infrastructure of Funnel.io, but for an agency with under 20 clients that needs something live this week, it is hard to beat on cost and speed.
DashThis earns its place on the shortlist primarily through template cloning. Pre-made dashboards and template cloning dramatically reduce operational overhead, and DashThis builds that feature into its core workflow. Agencies scaling beyond manual template edits should prioritise template-sync features. Connector count (34+) is lower than competitors, so validate your specific sources before committing.
1ClickReport does one thing well: automated PDF report generation on a schedule. If your client deliverable is a recurring PDF summary rather than a live dashboard, this is worth evaluating. Limited connector set and basic customisation mean it is not a full reporting stack replacement.
Porter Metrics suits marketing teams tracking cross-channel campaign outcomes with simple templates. Scheduled client outputs and a clean interface make it accessible, though connector depth is modest compared to Supermetrics or Funnel.io.
Cometly and Metrics Watch are narrow tools. Cometly simplifies multi-channel marketing summaries; Metrics Watch focuses on KPI alerting and threshold monitoring. Both suit teams that need one specific capability rather than a full reporting platform.
Cyfe and Coupler.io serve small teams. Cyfe aggregates social, marketing, and business metrics into a single dashboard view. Coupler.io moves data from apps into Google Sheets or Excel on a schedule — useful when a spreadsheet is your reporting destination and you want scheduled extraction without building a pipeline.
Broader BI and dashboard platforms
Microsoft Power BI is the natural choice for organisations already invested in Microsoft 365 and Azure. Deep semantic modelling, broad enterprise integrations, and governance features make it the strongest self-serve BI option for in-house teams. The limitation for agencies is white-labelling: native white-label capability requires Premium capacity licensing, which pushes costs up significantly. Power BI’s full feature set is well-documented and the platform has a large UK user community.

Tableau is where data teams go when they need exploratory analysis and complex visualisations. It is not an agency reporting tool in the traditional sense — it is an analyst’s surface. Setup and maintenance require data skills, and client-ready white-label outputs need additional configuration.
Looker Studio (formerly Data Studio) is free to licence and infinitely customisable, which makes it attractive on paper. In practice, it frequently needs engineering hours and fragile connectors unless paired with a paid connector layer. Token expiry is a recurring operational problem. For teams with engineering capacity, it is a powerful option. For agencies without it, the hidden cost of maintenance often exceeds the licence savings.
Klipfolio offers real-time KPI dashboards with an approachable visual builder. It sits between the entry-level agency tools and the full BI platforms — a reasonable choice for SMB teams that want live refresh without the complexity of Power BI.
Geckoboard is deliberately simple: clear metric displays and scoreboard-style views for operations teams and managers. It is not a client reporting tool in the agency sense, but it is excellent for internal KPI visibility and live status boards.
Databox targets marketing and sales teams with pre-built widgets and mobile-first KPI monitoring. Quick to set up, limited in depth. White-label capability is basic.
Grow.com consolidates multiple data sources into executive dashboards with moderate customisation. Mid-market teams that need a consolidated executive view without heavy engineering will find it serviceable.
Zoho Analytics is the budget BI option with a broad connector set and tight integration with the Zoho suite. For SMB teams already using Zoho CRM or Zoho Books, it is the obvious low-cost reporting layer.
Datapine balances ease of use with data modelling and visual analytics for mid-market teams. It sits between Zoho Analytics and Tableau in terms of depth and price.
Teamwork.com and ProWorkflow are project management platforms with reporting modules. Both suit agencies that want project-level reporting tied to task and time data, rather than marketing or analytics KPIs.
Sisense is an embedded analytics platform for developer-led teams building analytics into software products. It is not a client reporting tool for agencies.
Enterprise data layer and ETL tools
Funnel.io is not a dashboard tool. It is a connector infrastructure layer that extracts and normalises marketing data to feed BI tools and data warehouses. Enterprise setups use a data-warehouse layer or reliable connector infrastructure to avoid token expiry failures, and Funnel.io is the most cited solution for that problem. Pricing and implementation are at enterprise scale — expect multi-week setup and significant investment.
Supermetrics occupies a similar space but at a lower price point. It pulls marketing data into destinations like Google Sheets, BigQuery, or Looker Studio. It is an extraction tool, not a visualisation tool — you still need a dashboard surface on top.
Improvado and Integrate.io are enterprise ETL/ELT platforms for organisations building warehouse-first reporting stacks. Both require engineering projects to implement and are priced accordingly.
ThoughtSpot takes a different approach: search-driven analytics that lets non-technical users query data in natural language. It is a compelling capability for organisations with large datasets and non-analyst end users, but it is enterprise-priced and not a fit for agency client reporting.
Domo is a full-stack BI and analytics platform with built-in apps and embedded options. Domo recommends prioritising clarity and actionability over sheer metric count, and its platform reflects that philosophy with interactive elements and alerting. Enterprise pricing and setup complexity mean it belongs in the infrastructure band, not the agency quick-start category.
HubSpot and Salesforce are CRM and marketing platforms that act as primary data sources for dashboards rather than dashboard tools themselves. Both have native reporting modules, but their value in this context is as connectors feeding purpose-built reporting surfaces.
Google Analytics (GA4) is the standard web analytics source feeding most client dashboards. It is not a client reporting tool on its own, but it is the most common data source in the stack.
Pro Tip: Before committing to any self-serve tool, connect one real client account during the trial and let it run for 72 hours. Check whether the connector refreshes without manual intervention and whether token expiry triggers an alert or a silent failure. Most connector problems surface within the first three days.
How to choose the right client reporting dashboard for your team
Work through these steps before signing up for any tool or retainer.
- Define your deliverable first. A live dashboard for internal monitoring and a packaged PDF report for a client are separate operational products with different tool requirements. Decide which one you are building before evaluating features.
- Audit your data sources. List every source you need to connect: GA4, Google Ads, Meta Ads, LinkedIn, HubSpot, Salesforce, ecommerce platforms. Cross-reference that list against each tool’s published connector directory. Do not assume a connector exists — verify it.
- Test connector reliability, not just connectivity. Connect a live client account during the free trial and monitor it for 72 hours. Check that token refresh is automatic, that data gaps trigger alerts, and that the connector handles source API changes without breaking.
- Evaluate template cloning and scale features. If you have more than ten clients, manually rebuilding a template for each one is a margin killer. Test whether the tool supports template cloning, bulk scheduling, and per-client permission controls.
- Check white-label depth. Can you remove all vendor branding, use your own domain, and deliver a report that looks like it came from your agency? Some tools offer this on entry plans; others lock it behind premium tiers.
- Verify automated delivery and alerting. Scheduled PDF delivery, email dispatch, and threshold alerts should be configurable without engineering. If setting up a scheduled report requires a developer, factor that into the true cost.
- Confirm GDPR and data residency. Ask the vendor explicitly: where is client data stored? Is EU/UK data residency available? What is the data processing agreement (DPA) process? For UK agencies handling client data, this is not optional.
Questions to ask vendors before buying:
- What is your data refresh SLA and how are connector failures communicated?
- Who owns connector maintenance when a source API changes?
- How does the tool handle token expiry across multiple client accounts?
- What are the multi-client permission controls and can clients access their own portal without seeing other clients’ data?
- Is UK or EU data residency available, and do you provide a standard DPA?
- What is your UK support availability and typical response time?
Red flags to watch for in demos:
- The demo uses pre-loaded sample data rather than a live connected source.
- White-label options are only available on the highest pricing tier.
- Template cloning is described as a “coming soon” feature.
- The vendor cannot provide a clear answer on data residency or DPA.
- Pricing is opaque and requires a sales call to get a number.
Pro Tip: Ask the vendor to show you what happens when a connector token expires mid-report. The answer tells you more about operational reliability than any feature demo.
What does each tool class cost, and how long until your first report?
| Tool class | Example tools | Pricing band | Time to first report | Setup complexity |
|---|---|---|---|---|
| Free / self-serve | Looker Studio, Google Analytics | Free licence; connector costs £50–£200+/month | Days to weeks | Engineering required |
| Entry SaaS | AgencyAnalytics, DashThis, Geckoboard, Coupler.io | £30–£150/month | Hours to 1 day | No engineering |
| Mid-tier SaaS | Whatagraph, Klipfolio, Databox, Grow.com, Datapine | £150–£500/month | 1–3 days | Minimal engineering |
| Enterprise platform | Power BI Premium, Tableau, Domo, Sisense | — | 2–8 weeks | Engineering project |
| Enterprise ETL layer | Funnel.io, Improvado, Integrate.io | £1,000–£10,000+/month | 2–8 weeks | Engineering project |
| Managed partner | Cloud 9 | Bespoke retainer | 1–2 weeks (scoped) | Handled by partner |
Hidden costs to budget for:
- Looker Studio engineering time: the licence is free, but connector layers (Supermetrics, Funnel.io) add monthly costs, and maintaining custom connectors requires ongoing developer hours.
- Enterprise pro services: Domo, Tableau, and Salesforce typically charge implementation fees on top of licensing. Budget for professional services engagements of several weeks.
- Per-client licensing: AgencyAnalytics and similar tools charge per client. At 30 clients, entry-tier pricing can exceed mid-tier flat-rate tools.
- Managed partner retainer: Cloud 9’s managed reporting is priced as a bespoke retainer based on scope. The trade-off is predictable monthly cost versus the variable engineering overhead of self-serve tools.
A quick pilot on an entry SaaS tool can be live within a day. An enterprise ETL rollout with a warehouse layer typically takes 2–8 weeks before a single client sees a dashboard. The managed partner route sits between those extremes: Cloud 9’s typical onboarding for a reporting retainer runs 1–2 weeks from scoping to first delivery.
What is a client reporting dashboard, and should you build, buy, or outsource?
A client reporting dashboard is a live, interactive surface that consolidates KPIs from multiple data sources into a single view. A client report is a packaged, point-in-time document — a PDF or deck — delivered on a schedule. Treating them as separate products is the first practical decision in any procurement process, because the best tool for one is rarely the best tool for the other.
Effective dashboards focus on consolidating data into a clear, actionable view with interactivity — filters and drill-downs that let users move from “what happened” to “why” without commissioning a new report. That interactivity requirement shapes which tools belong in a dashboard shortlist versus a reporting shortlist.
Three decision rules:
- Build when you have in-house engineering capacity, unique data models that no off-the-shelf connector covers, and the time to maintain infrastructure. Looker Studio with a custom connector layer is the typical build route.
- Buy when you need fast white-label delivery, reusable templates, and scheduled outputs without engineering overhead. Whatagraph, DashThis, and AgencyAnalytics are the buy route.
- Outsource when you want UK support, predictable delivery, and integrated reporting across website, CRM, and analytics without building or maintaining anything yourself. Cloud 9’s managed reporting retainer is the outsource route.
Technical signals that push you toward each choice:
- High data volume with custom reconciliation needs → build or enterprise ETL layer
- Multiple marketing channels, standard KPIs, 10+ clients → buy (purpose-built platform)
- Limited engineering, mixed data sources, need for UK support and GDPR guidance → outsource
Dashboard types also vary by audience: analytical dashboards serve data teams exploring trends; strategic dashboards serve executives tracking high-level KPIs; operational dashboards serve teams monitoring live metrics; tactical dashboards serve managers tracking short-term targets. Matching the tool to the dashboard type and audience is as important as matching it to the data source.
When is Cloud 9 the better choice for UK teams?
The honest answer is: when the engineering cost of self-serve tools exceeds the cost of a managed retainer, and when UK support and data residency matter.
Cloud 9 is the practical choice for UK teams that have tried self-serve reporting tools and found the connector maintenance, template updates, and client onboarding consuming hours that should be billable. The managed retainer model means reporting is delivered as an outcome — not a project your team has to maintain.
Scenarios where Cloud 9 is the recommended route:
- Your team has no dedicated data engineer and connector failures currently go unnoticed until a client complains.
- You need integrated reporting across website analytics, CRM, ecommerce, and paid media — sources that require custom integration work rather than a standard connector.
- UK data residency and a clear DPA are non-negotiable for your clients.
- You want reporting as part of a broader managed digital service that includes hosting, SEO, and CRM automation, rather than a standalone SaaS subscription.
- You have tried Looker Studio or a similar free tool and found the maintenance overhead unsustainable.
Cloud 9’s managed reporting work includes automated ecommerce reporting and analytics for UK SMEs, combining data integration, scheduled delivery, and white-labelled outputs under a single retainer. The web analytics and digital decisions work demonstrates how analytics-led reporting translates into practical business decisions rather than vanity metrics.
Trust signals worth noting:
- UK-based team with local support hours
- Combined service offer: analytics, hosting, CRM automation, and reporting under one agreement
- Managed retainer model with defined deliverables rather than open-ended SaaS licences
- Practical experience with ecommerce and B2B reporting automation
Pro Tip: When evaluating a managed partner, ask for a sample report from a comparable client sector before signing. The quality of that sample tells you more about delivery standards than any sales deck.
Key takeaways
For most UK teams, the right client reporting dashboard tool is the one that matches your engineering capacity, client volume, and delivery format — not the one with the most connectors.
| Point | Details |
|---|---|
| Match tool class to engineering capacity | Purpose-built SaaS tools suit agencies without engineers; enterprise platforms require dedicated data resource. |
| Connector reliability beats feature count | Token expiry and connector failures are the most common operational breakdown; test reliability before committing. |
| Template cloning is a scaling requirement | Agencies with more than ten clients need template cloning and bulk scheduling to avoid a labour bottleneck. |
| Hidden costs make “free” tools expensive | Looker Studio’s licence is free, but connector layers and engineering hours add significant ongoing cost. |
| Cloud 9 suits teams that want reporting as an outcome | Cloud 9’s UK-managed retainer removes engineering overhead and includes integrated analytics, CRM, and ecommerce reporting. |
The hidden cost of “free” tools is usually someone’s time
The conventional wisdom in agency reporting is that Looker Studio is the smart choice because it is free. After watching enough agencies burn engineering hours on connector maintenance, token refresh scripts, and template rebuilds, that framing deserves scrutiny.
The licence cost of Looker Studio is zero. The operational cost is not. Every time a source API changes, someone has to fix the connector. Every time a token expires, someone has to notice before the client does. Every time you onboard a new client, someone has to rebuild the template from scratch unless you have invested in a proper cloning workflow. That “someone” is usually a developer or a senior analyst whose time costs more per hour than a mid-tier SaaS subscription.
The tools that actually scale for agencies are the ones that treat connector maintenance and template cloning as first-class features, not afterthoughts. DashThis, Whatagraph, and AgencyAnalytics were built around that operational reality. They are not as flexible as Looker Studio, but flexibility is only valuable if you have the engineering capacity to use it.
The other thing that gets underestimated is the value of a managed partner for teams at the intersection of reporting and broader digital operations. If your reporting stack needs to pull from a CRM, an ecommerce platform, a hosting environment, and a paid media account simultaneously, maintaining four separate connector relationships is a project in itself. A managed partner that handles all of those integrations under one retainer is not a luxury — it is often the cheaper option once you account for the engineering time you are not spending.
My honest position: if you have a data engineer and more than 20 clients, build on a proper BI platform with a reliable connector layer. If you have neither, buy a purpose-built agency tool or outsource the whole thing. The middle ground — a free tool maintained by a non-engineer — is where most reporting stacks quietly fall apart.
Cloud 9 takes the engineering burden out of client reporting
Self-serve reporting tools are the right answer for teams with the engineering capacity to maintain them. For everyone else, the retainer model is worth a serious look.
Cloud 9’s managed reporting service handles the integration, maintenance, and delivery of client-facing dashboards and reports as part of a UK-based retainer. That means no connector tokens to refresh, no template rebuilds when a client onboards, and no late-night fixes when a source API changes. Reporting is delivered as a defined outcome, not an ongoing internal project.
Cloud 9 works with established UK SMEs, membership organisations, and professional services firms that need integrated reporting across website analytics, CRM, ecommerce, and paid media. The service sits alongside digital marketing, CRM and marketing automation, and managed cloud services, so your reporting reflects the full picture of your digital operations rather than one channel in isolation.
To find out whether a managed reporting retainer fits your situation, get in touch with the Cloud 9 team for a scoping conversation. There is no obligation, and the conversation typically takes 30 minutes.
Useful sources and vendor links
The comparisons and recommendations in this article draw on the following sources. Validate connector coverage and UK support directly on vendor pages during your trial period, as integration directories and pricing change frequently.
- Microsoft Power BI — official product documentation and pricing
FAQ
What is the best client reporting dashboard tool for UK agencies?
For most UK agencies, Whatagraph or AgencyAnalytics offers the fastest path to white-labelled client reports with minimal engineering. Teams that want a fully managed service with UK support should consider Cloud 9’s managed reporting retainer.
How much does client reporting dashboard software cost?
Entry SaaS tools typically run £30–£150 per month; mid-tier platforms range from £150–£500 per month. Enterprise platforms and ETL layers can reach £1,000–£10,000+ per month, and managed partner retainers are priced by scope.
Is Looker Studio really free for client reporting?
The Looker Studio licence is free, but reliable client reporting usually requires a paid connector layer and ongoing engineering time to maintain. Those costs frequently exceed the monthly fee of a purpose-built agency reporting tool.
What should I test during a free trial of a reporting tool?
Connect a live client account and monitor it for 72 hours. Check that connectors refresh automatically, that token expiry triggers an alert rather than a silent failure, and that template cloning works as described. Connector reliability is the most common operational failure point.
When does it make sense to outsource reporting to a managed partner?
Outsourcing makes sense when your team lacks a dedicated data engineer, when you need integrated reporting across multiple systems (CRM, ecommerce, analytics), or when UK data residency and a clear data processing agreement are required by your clients.