

Connect your ecommerce platform, payment processor, ad channels, email tool and CRM into a single governed pipeline feeding a central data store and dashboard. That is the architecture. Everything else is implementation detail. Teams that make this shift typically save several hours per week on manual consolidation, and the quality of decisions improves because everyone is working from the same auditable numbers rather than competing spreadsheets.
Three things to do right now:
- Audit your data sources. List every system that holds revenue, customer or marketing data: Shopify, Stripe, Google Ads, Meta Ads, Klaviyo, Google Analytics 4 (GA4), and your CRM.
- Map critical KPIs to a single canonical schema. Agree on definitions before you build anything. “Revenue” means the same thing in every system from day one.
- Run a short pilot on one high-value channel. Validate the pipeline end-to-end on a small scope before scaling.
Pro Tip: Pick the channel where reporting pain is highest for your pilot. A quick win there builds internal confidence and surfaces data-quality issues before they affect the whole stack.
Table of Contents
- Why should UK SMEs automate ecommerce reporting?
- What does an automated ecommerce analytics stack look like?
- How do you implement ecommerce data automation step by step?
- Which KPIs should you automate, and what can you do with them?
- What does ecommerce reporting automation cost, and how long does it take?
- UK compliance and security checklist for automated reporting
- How do you choose the right partner for managed ecommerce analytics?
- How Cloud9 approaches ecommerce reporting automation
- Key takeaways
- The part most guides skip
- Cloud9’s managed reporting service for UK SMEs
- Useful sources
- FAQ
Why should UK SMEs automate ecommerce reporting?
The commercial case is straightforward. Manual reporting is slow, error-prone and expensive in staff time. Automated sales reporting replaces that with a live, governed feed that every team can trust.
- Time savings. Centralising Google Ads, Meta Ads, Klaviyo and store data into automated dashboards removes several hours of manual work per week per analyst. Agent-based reporting tools report recoveries of several hours per reporting cycle and significantly faster report delivery.
- Decision quality. Fresher numbers with a clear audit trail mean fewer “which version is right?” arguments in Monday morning meetings.
- Revenue impact. Automated data flows make cohort and segmentation analysis feasible, letting you identify high-value customers by location, product type or discount behaviour and target them with personalised campaigns that lift average order value (AOV) and lifetime value (LTV).
- Operational benefits. Automation monitors inventory in real time and triggers reorder logic, reducing stockouts and overstock without manual checks.
Pro Tip: Frame the business case internally around decision speed, not just hours saved. A finance director will approve budget faster when the pitch is “we catch a bad week while we can still act on it” rather than “we save four hours on spreadsheets.”
What does an automated ecommerce analytics stack look like?
The architecture has three layers: connectors → central data store → analytics and dashboards.
Connectors pull data from Shopify (orders, products, customers), Stripe (payments, refunds), Google Ads and Meta Ads (spend, impressions, conversions), Klaviyo (email sends, opens, revenue attribution) and GA4 (sessions, events, funnels). Routine events trigger downstream workflows automatically without manual intervention, so a new order flows to fulfilment and an abandoned cart triggers a Klaviyo sequence without anyone pressing a button.

The central store normalises everything into a canonical schema. This is where data governance lives: consistent event naming, PII tokenisation, retention policies and audit trails.
The analytics layer sits on top. This is where stateful systems earn their keep. A stateful analytics engine remembers your business definitions, your anomaly thresholds and your preferred segmentation logic across sessions. That persistent memory means you are not re-explaining your KPI definitions every time you run a query, and anomaly detection improves over time rather than resetting.
Real-time vs batch: real-time pipelines suit inventory alerts and ad-spend anomaly detection. Batch updates (hourly or nightly) are sufficient for cohort analysis, LTV modelling and weekly executive dashboards. Running everything in real time adds cost and complexity without proportionate benefit for most SMEs.
| Dimension | DIY point tools | Integrated orchestration |
|---|---|---|
| Setup time | Days per connector | Weeks, but unified |
| Data sources | Limited by tool | Shopify, Stripe, GA4, Ads, Klaviyo, CRM |
| Real-time updates | Varies | Configurable per layer |
| Cost model | Per-tool subscriptions | Single managed fee or warehouse + tooling |
| Analytics depth | Basic dashboards | Cohort, segmentation, attribution |
| GDPR / security | Self-managed | Governed centrally |
| Support / SLA | Community or ticket | Defined SLA with a partner |
Pro Tip: During scoping, ask whether the connector is stateful or stateless. A stateless connector fetches data on demand but forgets context. A stateful one retains your schema mappings and anomaly baselines, which cuts ongoing tuning time significantly.
How do you implement ecommerce data automation step by step?
A staged rollout reduces risk and builds confidence at each phase.
- Phase 0: stakeholder alignment. Agree which sales channels are in scope, who owns each KPI definition, and what “done” looks like for the pilot. Without this, data modelling becomes a political argument later.
- Phase 1: audit and schema mapping. Document every data source, field name and update frequency. Agree canonical definitions for revenue, order, customer and session. A shared Google Sheet works well here as a temporary validation layer before the warehouse is live.
- Phase 2: pilot. Configure connectors for one channel or product line. Backfill 90 days of historical data. Validate outputs against source-system reports. Fix discrepancies before adding more sources.
- Phase 3: iterate and scale. Add alert automations, cohort refresh schedules and the remaining channels. Connect CRM and Stripe for cleaner financial forecasts and faster reconciliation.
- Phase 4: handover and optimisation. Document the runbook. Train the team. Set a quarterly review cadence. Automation is not set-and-forget; scheduled anomaly reviews and iterative model tuning are what keep outputs accurate.
A typical pilot runs several weeks. Scaling to all channels takes several months for a DIY build; a managed engagement often reaches live within a couple of months.
Pro Tip: Backfilling 90 days of data before go-live is the single step most teams skip and most regret. Without it, your first cohort analysis has no baseline.
Which KPIs should you automate, and what can you do with them?
Web analytics drive decisions that grow revenue only when the right metrics refresh at the right cadence.
| KPI | Why it matters | Refresh cadence |
|---|---|---|
| Revenue (gross / net) | Primary health signal | Real-time |
| Average order value (AOV) | Pricing and upsell lever | Daily |
| Conversion rate | Funnel efficiency | Real-time |
| Customer acquisition cost (CAC) | Channel profitability | Daily |
| Lifetime value (LTV) | Retention investment signal | Weekly |
| Cohort retention | Product-market fit indicator | Weekly |
| Churn rate | Subscription / repeat-purchase health | Weekly |
Beyond the basics, three automated analyses deliver outsized value:
- Cohort analysis. Group customers by acquisition month and track their revenue contribution over time. This tells you which channels bring buyers who actually return, not just buyers who convert once.
- Segment-triggered campaigns. When a customer crosses an LTV threshold or drops into a churn-risk segment, Klaviyo fires automatically. No manual list exports.
- Anomaly detection. A threshold watch on daily revenue (for example, alert if revenue falls significantly below the trailing average) catches a bad day before it becomes a bad week.
Pro Tip: Visitor intelligence tools can enrich your segmentation by identifying company-level visitors before they convert, giving your sales team a warm lead list from the same pipeline.
What does ecommerce reporting automation cost, and how long does it take?
Three routes, three cost profiles:
- DIY. Internal developer time (typically 2–4 weeks of engineering) plus tooling subscriptions. Lower cash cost, higher opportunity cost. Data modelling and QA consume most of the time.
- Hybrid. Off-the-shelf connectors plus a contractor for data modelling and dashboard build. Faster than pure DIY; still requires internal ownership.
- Managed. A partner handles connectors, modelling, dashboards, SLA and ongoing optimisation. Higher monthly cost, but the managed services model typically delivers a live system in 6–8 weeks and removes the internal resource burden entirely.
The tasks that consume the most time regardless of route: data modelling (agreeing and enforcing the canonical schema), connector QA (validating that Shopify revenue matches Stripe receipts), and training.
UK compliance and security checklist for automated reporting
Before any data leaves your systems for a warehouse or third-party tool, these controls must be in place.
- Lawful basis and consent. Marketing data (Klaviyo, GA4) requires a documented lawful basis under UK GDPR. Consent records must be auditable.
- Data minimisation. Only pull the fields you actually need. PII in the analytics layer should be tokenised or pseudonymised.
- Processor agreements. Every third-party connector is a data processor. You need a signed Data Processing Agreement (DPA) with each one, per ICO guidance.
- Encryption. Data in transit (TLS 1.2 minimum) and at rest. Role-based access controls on the warehouse and dashboards.
- Retention policies. Define and enforce how long raw event data is kept. Most SMEs need no more than 24 months of granular data.
- DPIAs. A Data Protection Impact Assessment is required where processing is likely to result in high risk, for example profiling customers at scale.
- Breach response. Document the procedure. The ICO’s 72-hour notification window applies.
Pro Tip: Ask every connector vendor for their ISO 27001 certificate or SOC 2 report before signing. A vendor who cannot produce either within 48 hours is a red flag.
How do you choose the right partner for managed ecommerce analytics?
Evaluation criteria to weight:
- Integration breadth: native connectors for Shopify, Stripe, GA4, Google Ads, Meta Ads and Klaviyo, not just generic API wrappers.
- Data modelling expertise: can they show you a sample canonical schema and explain their event-naming conventions?
- SLA and security posture: written SLA with defined response times; evidence of UK GDPR compliance.
- Analytical capabilities: cohort analysis, segmentation, root-cause analysis, not just pre-built dashboards.
Red flags to watch for:
- No audit logs or opaque data lineage.
- Essential connectors gated behind higher pricing tiers.
- No UK-specific compliance documentation.
- Vague answers about where data is stored geographically.
Questions to ask during vendor interviews:
- Can you share an anonymised runbook from a comparable engagement?
- How do you handle schema changes when a source platform updates its API?
- What does your anomaly detection process look like, and who owns the alert triage?
- Show me a sample audit trail from your data warehouse.
- What is your documented breach response procedure?
Pro Tip: Request a sample dashboard built on anonymised data during the sales process. A partner who cannot show you a working output before you sign is asking you to buy on faith.
How Cloud9 approaches ecommerce reporting automation
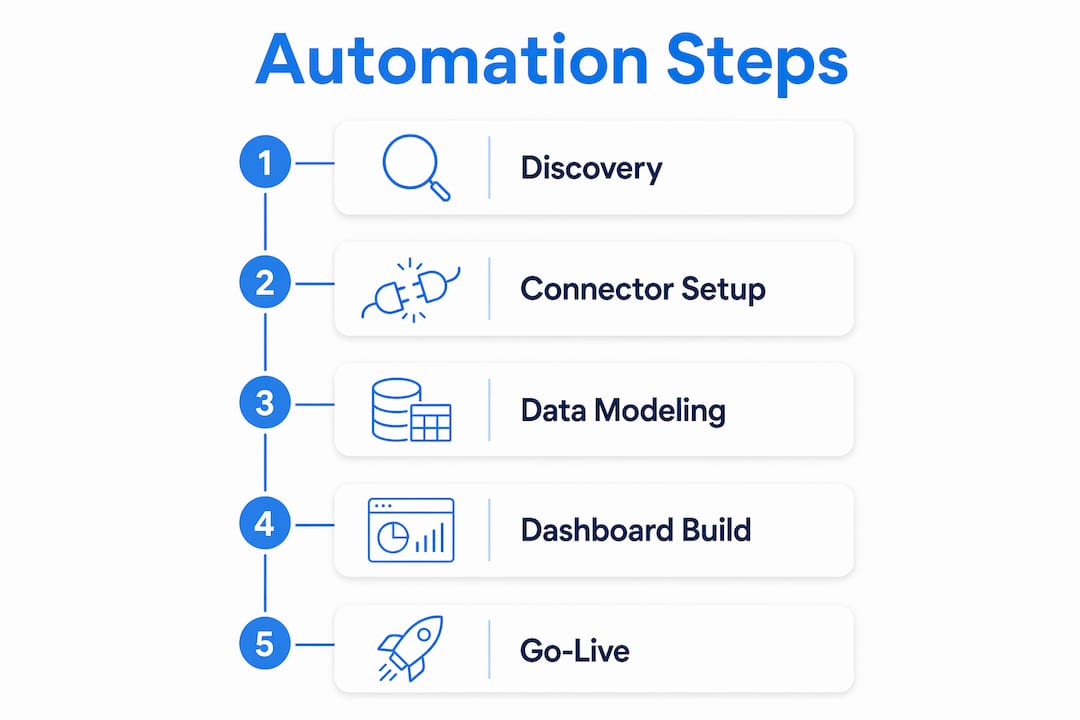
Cloud9’s engagement model follows a five-stage process: discovery and scoping, connector integration, canonical data modelling, dashboard and alert build, team training and managed optimisation. The AI automation services layer adds anomaly detection and agent-driven Q&A over your live data, so your team can ask plain-English questions and get answers from the warehouse rather than waiting for a scheduled report.
Expected outcomes for a standard SME engagement:
| Outcome | Typical result |
|---|---|
| Manual reporting time saved | Several hours per week |
| Report delivery speed | Significantly faster than manual process |
| Pilot to live timeline | 4–8 weeks |
| Channels connected | Shopify, Stripe, GA4, Google Ads, Meta Ads, Klaviyo |
| Compliance documentation | DPAs, data-residency confirmation, audit logs |
Cloud9’s CRM and marketing automation capability means the same engagement can wire your customer data into personalised Klaviyo sequences, so the analytics layer and the activation layer are built and governed together rather than bolted together later.
Key takeaways
Automating ecommerce reporting and analytics requires a governed pipeline connecting your core platforms into a central data store, with a defined KPI schema and a staged rollout that validates data quality before scaling.
| Point | Details |
|---|---|
| Architecture first | Connect Shopify, Stripe, GA4, Ads and Klaviyo into one governed pipeline before building dashboards. |
| Time savings are real | Centralising data sources typically saves several hours per week in manual consolidation. |
| Pilot before scaling | Run a 4–8 week pilot on one channel; backfill 90 days of data to establish a baseline. |
| Compliance is non-optional | Every third-party connector needs a signed DPA; document lawful basis for all marketing data. |
| Cloud9 managed option | Cloud9 delivers a live, validated dashboard in 4–8 weeks with full compliance documentation included. |
The part most guides skip
Most articles about automated ecommerce analytics focus on tool selection. The harder problem is change management: getting your team to trust the new numbers enough to stop maintaining the old spreadsheets.
The pattern Cloud9 sees repeatedly is this: a business invests in a solid pipeline, the dashboards go live, and then two weeks later the finance manager is still pulling a manual report “just to check.” That parallel process is not caution. It is a signal that the canonical schema was not agreed with the right stakeholders before build, or that the validation phase did not include the people who will actually use the outputs.
The fix is to involve the sceptics early. Bring the finance manager into Phase 1 schema mapping. Show the operations lead the pilot dashboard before it is finished and ask them to find the errors. When people help build the definitions, they trust the outputs.
Pro Tip: Schedule a “break the dashboard” session with your team two weeks after go-live. Ask them to find a number that looks wrong. They usually find one. Fixing it publicly builds more trust than any amount of pre-launch validation.
Cloud9’s managed reporting service for UK SMEs
Fragmented dashboards cost UK SMEs hours every week and produce the kind of stale, inconsistent numbers that lead to poor decisions on ad spend and stock. Cloud9’s managed ecommerce reporting service replaces that with a single governed pipeline, a central data store, and live dashboards your whole team can use from day one.
The service covers connector setup (Shopify, Stripe, Google Ads, Meta Ads, Klaviyo, GA4), canonical data modelling, dashboard and alert build, and ongoing managed optimisation with a defined SLA. The pilot runs 4–8 weeks with clear deliverables: a validated dashboard, a documented runbook, and full compliance paperwork. Cloud9’s managed cloud infrastructure keeps your data secure and UK-resident throughout.
To get started, contact Cloud9 for a scoping call. You will receive a proposed pilot scope, an anonymised sample dashboard, and Cloud9’s compliance documentation before you commit to anything.
Useful sources
- ICO guidance on UK GDPR and data processors — the primary reference for lawful basis, DPAs and breach notification obligations.
- Ecommerce automation overview (IBM) — covers inventory automation, order workflows and the case for ongoing optimisation.
- Ecommerce data automation and segmentation (Peel Insights) — practical guide to cohort analysis and LTV-driven segmentation.
- Automate your reporting (Polar Analytics) — time-saving benchmarks for centralising ad and store data.
- Ecommerce automation for business (Zapier) — connector patterns and workflow examples for order, fulfilment and CRM automation.
- Cloud9 ecommerce automation explained — Cloud9’s primer on how interconnected technology automates fulfilment, CRM and reporting.
FAQ
How long does it take to automate ecommerce reporting?
A pilot covering one channel typically runs several weeks; scaling to all channels takes several months for a DIY build, or a couple of months with a managed partner like Cloud9.
What data sources should I connect first?
Start with Shopify (or your primary store platform), Stripe, and one ad channel. These three cover revenue, payments and acquisition cost, giving you the core KPIs from week one.
Is automated ecommerce analytics compliant with UK GDPR?
Yes, provided you have signed DPAs with every connector vendor, a documented lawful basis for marketing data, and PII tokenised or pseudonymised in the analytics layer, per ICO requirements.
How much does ecommerce reporting automation cost for an SME?
Cost varies by route: DIY requires internal engineering time plus tooling subscriptions; a managed engagement typically carries a monthly fee covering connectors, modelling, dashboards and SLA support. Cloud9 provides a scoped quote after a discovery call.
What is the difference between real-time and batch reporting?
Real-time pipelines suit inventory alerts and ad-spend anomaly detection; batch updates (hourly or nightly) are sufficient for cohort analysis, LTV modelling and executive dashboards, and cost less to run.