

Start by adding HTTP(S) checks for your critical pages plus SSL and expiry alerts: these three catch the majority of avoidable outages. Add a heartbeat monitor for any scheduled job, turn on checks from at least two regions, and configure two alert channels. You can have this minimum viable bundle running in well under 30 minutes.
TL;DR:
- Small websites should focus on HTTP(S), SSL, and heartbeat checks, with multi-region monitoring to reduce false positives.
- Use short intervals of one minute for critical pages and longer intervals for low-priority areas to optimize resource use and alert accuracy.
- Confirm outages from multiple regions before escalating, and keep an eye on false positives caused by routing issues or third-party service hiccups.
- Automate status updates and incident communication to prevent support overload, and regularly test alerts and thresholds to prevent silent failures.
- For revenue-impacting sites, a managed service offering integrated monitoring, incident response, and backups can relieve operational burdens.
Table of Contents
- What uptime monitoring covers and why it matters for small websites
- Essential checks to create first: a practical checklist
- Step-by-step setup: from signing up to verifying alerts
- Choosing check intervals and alert routing to reduce noise
- Multi-region monitoring and how to avoid false positives
- Status pages and incident communication: who to tell and how
- Routine maintenance: tests, audits and post-incident tuning
- Limitations and challenges of uptime monitoring
- When to choose managed monitoring vs DIY
- Cloud 9 managed hosting and website care
- FAQ
- Sources
What uptime monitoring covers and why it matters for small websites
Uptime monitoring is a scheduled check that confirms your website or service is reachable and behaving as expected, then tells you the moment it isn’t. For a small business, a missed alert can mean hours of lost sales or enquiries before anyone notices the site is down. Different monitor types watch for different failure modes, and a reliable setup usually combines several.
- HTTP(S) checks request a page and confirm a successful 2xx response, catching a server crash or a misconfigured redirect.
- Ping checks test whether a server responds at the network level, useful for spotting a host that has gone completely offline.
- Port/TCP checks confirm a specific service, such as a mail server, is accepting connections.
- DNS checks verify your domain resolves correctly, catching registrar or nameserver problems before visitors ever reach your server.
- SSL/TLS checks watch certificate validity, flagging an expired certificate that would otherwise lock visitors out with a browser warning.
- Keyword/content checks confirm a specific piece of text still appears on the page, catching a broken checkout form that still loads but no longer works.
- Heartbeat/cron checks wait for a scheduled job to report in, catching a silent backup or sync failure that would otherwise go unnoticed for weeks.
Essential checks to create first: a practical checklist
A resilient setup rarely needs more than a handful of well-placed monitors. Combining HTTP, keyword, SSL and heartbeat checks gives small sites layered coverage without unnecessary complexity, and a ‘minimum viable monitoring’ approach, starting small and expanding as incidents teach you what matters, suits most owners better than monitoring everything at once.
- Homepage and key landing pages: an HTTP(S) check, with a content assertion where the page includes text that proves it rendered correctly, not just that a server responded.
- Transactional pages and APIs: checkout, login and any payment or booking flow monitored as separate checks, since these can fail independently of the homepage.
- SSL and domain expiry monitors: set advance alerts at 30, 14 and 7 days before expiry so renewal never becomes an emergency.
- Heartbeat monitors for scheduled jobs: backups, cron tasks and sync processes should report in on schedule, with an alert if the check-in is missed.
- DNS and port checks for supporting services: mail servers, FTP access or any other service your business depends on outside the main website.
Pro Tip: Treat checkout and login as separate monitors from day one. A homepage that loads fine while the payment form silently breaks is one of the most common and costly blind spots.
Step-by-step setup: from signing up to verifying alerts
Setting up monitoring is a short, repeatable process once you know the order of operations.
- Sign up with a monitoring tool and add a monitor for each endpoint: give each a friendly name and note the expected response, whether that’s a status code, a load time, or specific text on the page.
- Choose the monitor type per endpoint: HTTP(S) for pages, port checks for services such as mail, heartbeat for scheduled jobs.
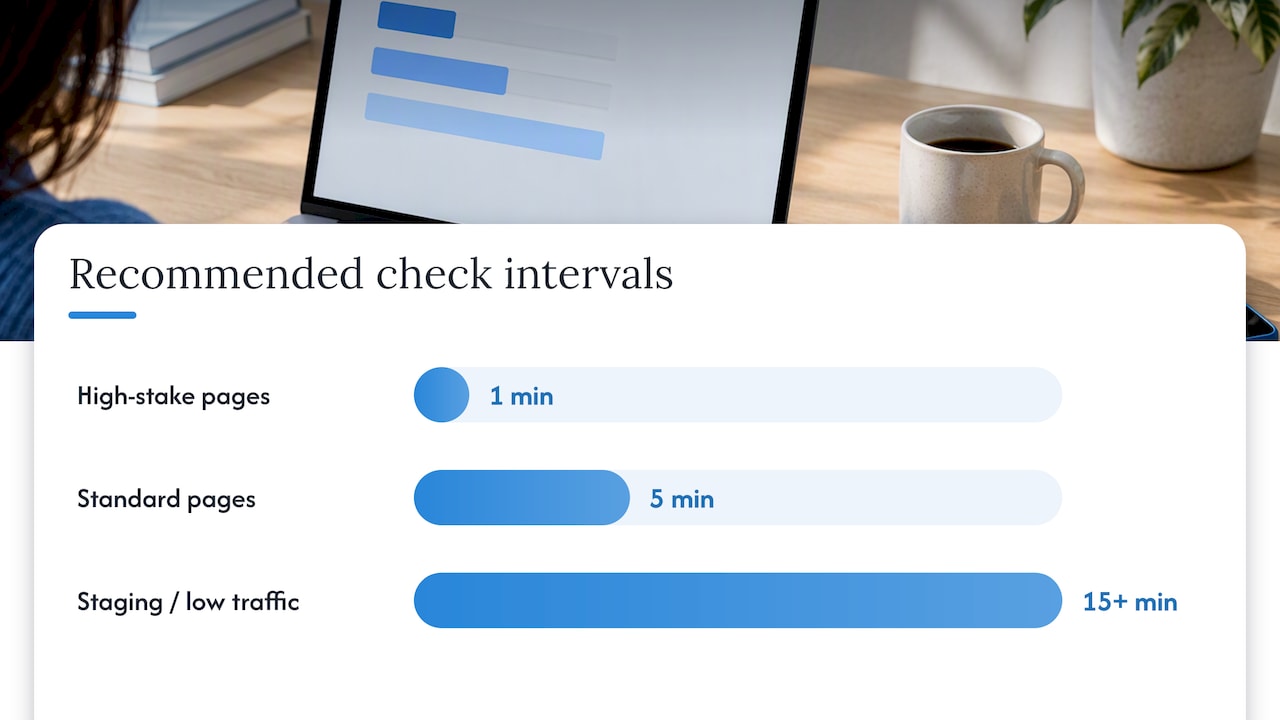
- Set the check interval based on risk: shorter intervals for pages that affect revenue, longer intervals for low-traffic or staging pages. Suggested intervals run from one minute for high-stakes pages to five minutes for standard pages and 15 minutes or more for staging.
- Set a sensible timeout: too short and you’ll get false alarms during normal traffic spikes, too long and you’ll wait minutes to learn about a real outage.
- Configure alert channels: email and push notifications for routine issues, a webhook or Slack integration for team visibility, and reserve SMS or phone calls for confirmed hard downs rather than every blip.
- Build an escalation policy: if the first responder doesn’t acknowledge within a set window, escalate to a second contact or channel.
- Test the full pipeline: simulate a failure, for instance by temporarily blocking the monitor’s access or taking a staging page offline, and confirm the alert fires, reaches the right channel, and escalates as designed.
Pro Tip: Run your first simulated outage during business hours, not at 2am. You want to be awake and paying attention the first time you see whether your escalation actually works.
A practical setup checklist covers exactly this sequence: define scope, set intervals, configure alerts, add multi-location checks, create a status page, then review and retest periodically. Skipping the testing step is the most common reason monitoring setups fail silently when they’re needed most.
Choosing check intervals and alert routing to reduce noise
The right interval depends on what a page does, not how important it feels. A one-minute interval on a checkout page catches a problem within moments; the same interval on a rarely visited staging page just burns through your plan’s check allowance and generates noise.
- Use one-minute checks for checkout, login and anything directly tied to revenue.
- Use five-minute checks for standard business pages such as the homepage, contact and service pages.
- Use 15-minute or longer checks for staging environments and low-priority internal tools.
- Confirm failures from multiple locations before paging a phone tree, rather than reacting to the first single check that fails.
- Use tags and groups to route alerts: infrastructure issues to whoever manages hosting, content or form failures to whoever manages the site day to day.
- Schedule maintenance windows to suppress alerts during planned deployments or known load peaks, so a deliberate change doesn’t trigger a false alarm.
Getting routing right matters as much as getting intervals right. A monitor that pages the wrong person, or pages everyone for a minor blip, trains your team to ignore alerts, which defeats the purpose of having them.
Multi-region monitoring and how to avoid false positives
A single checker in one location can’t tell you whether an outage is global or just a local routing problem. Checking from multiple regions lets you separate a genuine server failure from an ISP hiccup, a CDN edge issue, or a regional routing fault that only affects some visitors.
- Run checks from at least two or three geographically distinct locations where your plan allows it.
- Treat a failure seen from a single region as a signal to investigate, not an immediate page.
- Only escalate once the outage is confirmed from at least two distinct regions, which cuts false positives significantly.
- When only one region reports a failure, check a traceroute from that location, review your CDN’s status dashboard, and check whether the relevant ISP has reported an outage.
Pro Tip: Keep a bookmark folder of your CDN provider’s and major ISPs’ status pages. When a single-region alert fires, you’ll want to check these within seconds, not go hunting for them.
Status pages and incident communication: who to tell and how
A status page gives customers somewhere to check before they email support, which reduces incoming support load during incidents. Public pages are for customers and preserve trust by showing your aware and working on it; private pages serve internal stakeholders who need more detail without exposing infrastructure specifics externally.
- Wire your monitors directly to the status page so incidents post automatically rather than relying on someone remembering to update it.
- Automate subscriber updates by email or SMS so affected customers don’t need to keep refreshing the page.
- During an incident, publish what’s affected, roughly when it started, and an honest estimate of next steps.
- Avoid publishing internal technical detail, root cause speculation, or anything that isn’t yet confirmed.
- Close the incident with a short resolution note once service is restored, rather than leaving the page in limbo.
A status page also does quiet work outside incidents: it signals to prospective customers that you take reliability seriously.
Routine maintenance: tests, audits and post-incident tuning
Monitoring setups decay quietly if left alone. A phone number changes, a webhook gets deprecated, a threshold set two years ago no longer fits current traffic.
- Monthly: send a test alert through every channel to confirm email addresses, phone numbers and webhooks still work.
- Quarterly: run a full audit of every monitor, interval and escalation rule against your current site structure.
- After any incident: review the alert log for noise, tighten or loosen thresholds as needed, and update your runbook with what you learned.
Treating this as a recurring task, not a one-off setup, is what keeps monitoring useful a year from now rather than just at launch.
Limitations and challenges of uptime monitoring
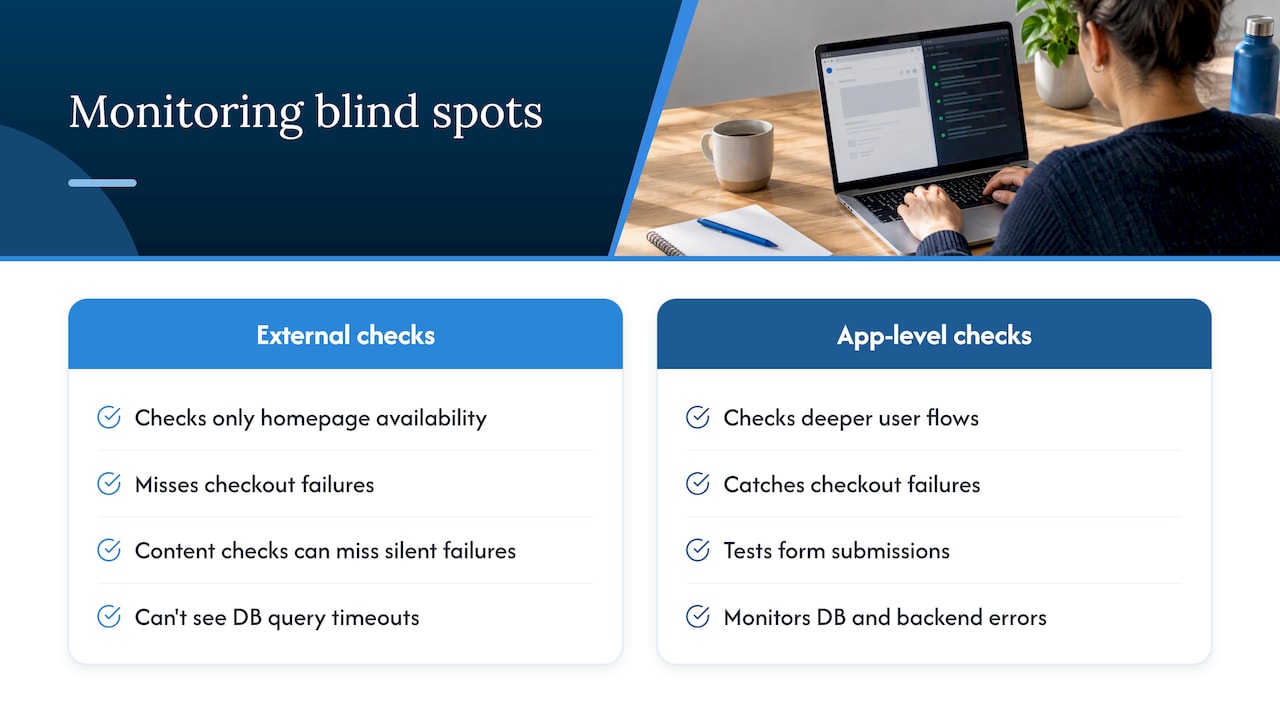
Monitoring tells you what it’s configured to check, nothing more, so it’s worth being honest about its blind spots. A monitor that only checks the homepage will miss a broken checkout for days. Content checks can report false negatives if a page loads the expected text but the underlying functionality has silently failed, such as a form that renders but no longer submits.
False positives are the more common daily annoyance: a single slow response during a traffic spike, a brief network blip at one checker location, or a maintenance window nobody suppressed, all of which can trigger alerts for nothing. Over time, repeated false positives train teams to ignore notifications, which is more dangerous than having no monitoring at all.
External checks also can’t see everything. A page might return a healthy status code while a database query behind it times out, or an API might respond correctly to the monitor’s exact request while failing for real users with different parameters. Monitoring from outside your infrastructure is a strong first layer, but it isn’t a substitute for proper application logging and error tracking for anything beyond basic availability. Building in periodic manual spot checks, alongside automated monitors, helps catch the gaps that any single tool will inevitably miss.
When to choose managed monitoring vs DIY
My honest view: DIY monitoring works well for sites where downtime is an inconvenience, not a revenue event, and where someone has the time to maintain the setup properly. Once uptime affects your income directly, or nobody on your team has spare hours for quarterly audits and alert tuning, a managed service becomes the pragmatic choice. Curated alerting, proper incident handling, and monitoring bundled with hosting support tend to save more time than they cost.
— Rob
Cloud 9 managed hosting and website care
If you’d rather not own the ongoing maintenance of a monitoring setup, our managed hosting and website care covers it as part of looking after your site day to day.

- Monitoring, incident response and patching handled as part of ongoing care, not a separate task on your list.
- Backups and recovery built in, so a failed job or a bad deployment doesn’t become a lost week.
- Suited to established small and medium businesses with a site to protect but limited time for infrastructure admin.
For businesses that want hosting, monitoring and ongoing support as one package rather than stitched together from separate tools, our Website as a Service model folds all of this in from the start. Either route gets you a working safety net without becoming the person who has to maintain it.
FAQ
What is the minimum uptime monitoring setup for a small site?
A practical starting point is an HTTP(S) check on your homepage and key pages, an SSL and domain expiry monitor, and a heartbeat check for any scheduled job such as backups. This covers the most common and most costly failure modes without requiring a large number of monitors.
How often should uptime checks run?
Interval should match risk: one minute for checkout or login, five minutes for standard business pages, and 15 minutes or more for staging environments. Running everything at one-minute intervals wastes plan allowance and adds noise without adding useful protection.
Why does my monitor show downtime when the site is actually fine?
This is usually a false positive caused by a single checker location hitting a temporary routing or CDN issue rather than a real outage. Confirming failure from at least two distinct regions before treating it as a genuine incident cuts this problem significantly.
Do I need a public status page for a small business site?
A public status page isn’t essential for every small site, but it reduces support enquiries during an incident by giving customers somewhere to check instead of emailing you. It’s most worthwhile once your site handles bookings, payments, or anything customers rely on daily.
What does Cloud 9 include for uptime if I don’t want to manage it myself?
Our managed hosting and website care covers monitoring, incident response, patching and backups as part of ongoing support, so you’re not left checking alerts yourself. Pricing for this and our other managed services is available on request through our services page.